

The Productivity Commission (PC) has released its annual review of productivity for the 2012/13 year and the news is poor. After a brief spurt the year before, Australian under-performance has returned with a vengeance to post a 0.8 fall in multi-factor productivity:
As the PC says:
This overview of Australia’s productivity performance in 2012-13 is based on the latest Australian Bureau of Statistics (ABS) annual estimates of multifactor productivity (MFP) and labour productivity (LP) growth for both the 12 industry market sector as a whole, and for each of its 12 individual industries.
Productivity performance is a key source of long-term economic growth, business competitiveness and real per capita ncome growth. Hence, it is an important determinant of a country’s living standards and wellbeing.
Productivity (the ratio of output produced to inputs used) measures how efficiently inputs, such as capital and labour, are used to produce outputs in the economy. It is sometimes referred to as productive efficiency. Productivity increases if output grows faster than inputs (or shrinks more slowly).
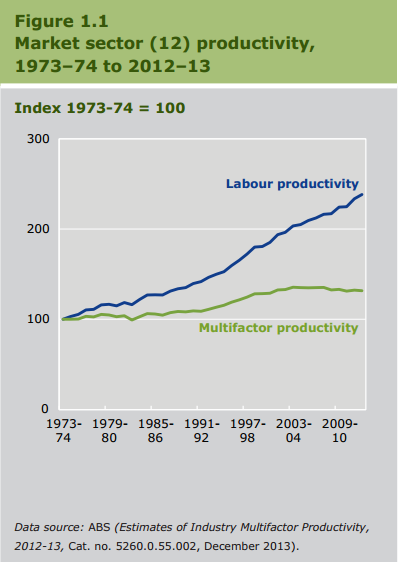
Multifactor productivity (output produced per unit of combined inputs of labour and capital) is the measure that comes closest to the underlying concept of productivity — efficiency of producers in producing output using both labour and capital. Labour productivity (output produced per unit of labour input) measures efficiency in the use of labour but it also captures the value added from growth in capital that supports increased output without increasing labour.
So, where’s it going wrong? Labour:
On the input side, capital growth of 6.1 per cent, though down from 6.8 per cent in the previous year, continued its strong decade-long growth trend. Labour input growth has remained subdued, rising by only 0.2 per cent in 2012-13. Overall, total input growth was 3.0 per cent in 2012-13, which more than offset output growth and resulted in MFP growth being a negative 0.8 per cent.
2012-13 was the ninth consecutive year of negative or very weak MFP growth in the market sector. This pattern over the last decade is atypical in the longer-term history of Australia’s productivity performance. In the current (incomplete) productivity cycle from 2007-08 to 2012-13, negative 0.6 per cent growth of MFP was the result of:
- relatively weak output growth (2.2 per cent per year), which is below the long-term average of 3.0 per cent
- per year (between 1973-74 and 2012-13)
- strong growth in capital input (5.5 per cent per year), which was significantly higher than the long-term average (4.4 per cent per year)
- marginal growth of labour input (0.3 per cent per year), which was below the historical average (0.8 per cent per year).
LP growth, which is determined by MFP growth and capital deepening, was 2.0 per cent in 2012-13. This was close to its long-term average, though down from 3.9 per cent in the previous year. The reduced rate of increase of LP in the latest year was largely due to the reversal of MFP growth from 0.8 per cent to -0.8 per cent. Growth in capital deepening, at 2.8 per cent in 2012-13, was similar to the 3.0 per cent recorded in the previous year and was well above the long-term average of 1.5 per cent per year.
How are sectors doing? Badly:
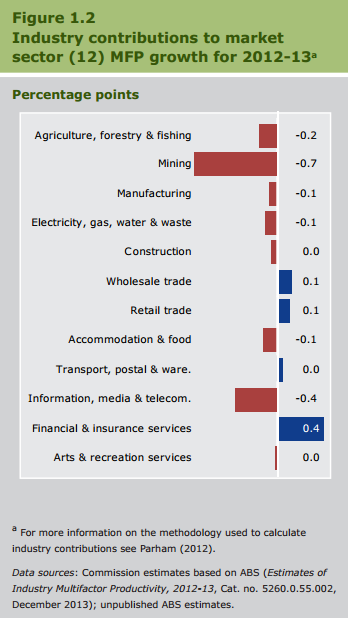
Weak growth in the majority of sectors and, what’s more, no difference between tradables and non-tradables that I can see. Mining is the standout loser, which will reverse as labour is shed and production rises, but even the winners are lousy.
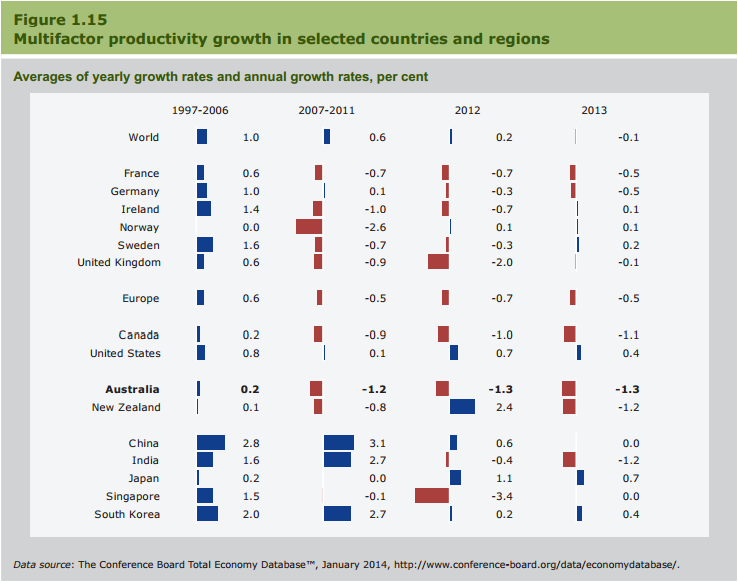
Versus other countries we’re the worst:
So, why so bad? The PC points to various reasons in each sector: investment in mining, weather in agriculture, over-investment in utilities etc.
I would describe the recipe this way. In a small and overly-concentrated economy with an increasingly narrow tradables exposure there are less and less competitive forces in play in the economy. Add in a strong labour movement, powerful entitlement culture and a rentier structure to politics in which incumbents in both labour and capital block reform. Sprinkle with a large and persistent land bubble to ensure inflationary pressure on fixed costs and voila, one beautiful productivity-resistant chocolate cake that feeds and fattens complacency in a population increasingly unable to rise from the couch.
It’s no coincidence that the similarly structured New Zealand economy shares our poor performance.
Full report here.
