

As noted earlier by Houses & Holes, the Australian Bureau of Statistics (ABS) has released the Consumer Price Index (CPI) data for the December quarter 0f 2013, which registered a large quarterly jump in prices, with the result also coming in above economists’ expectations.
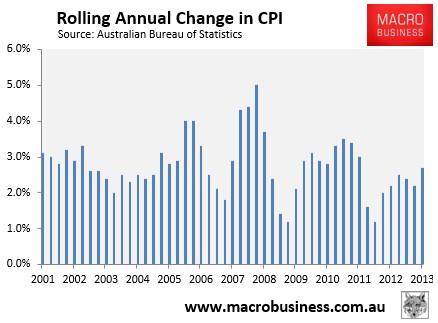
According to the ABS, headline CPI rose by a strong 0.8% in the December quarter, which follows September’s 1.2% rise. The 0.8% increase in the December quarter was double analyst’s expectations of a 0.4% increase over the quarter.

On an annual basis, headline CPI growth rose to 2.7% from 2.2% in the September quarter, which is at the upper end of the Reserve Bank of Australia’s (RBA) target of 2% to 3% growth over the medium term (see next chart).
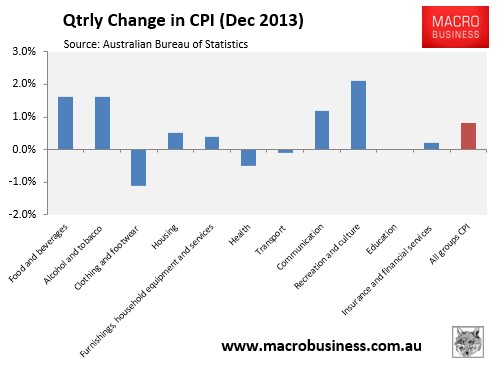
Looking at the core components, you can see that the spike in inflation was driven by rising food, alcohol & tobacco, and recreation costs, although seven of the key categories recorded increases in prices:
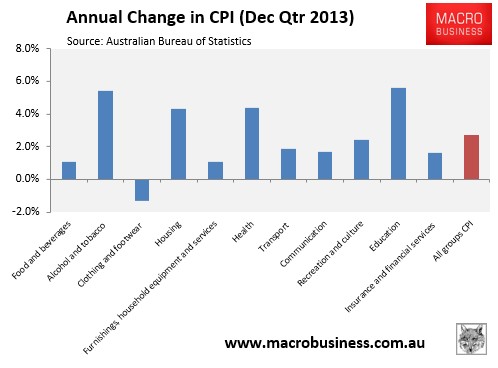
Over the year, solid price growth was experienced across health, education, housing, and alcohol & tobacco, whereas clothing & footwear prices fell (see next chart).
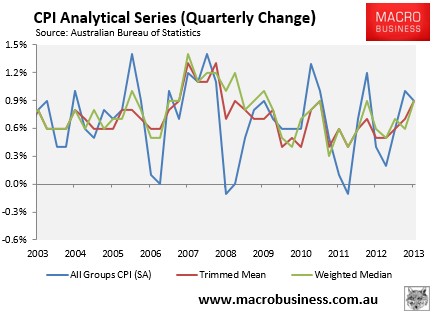
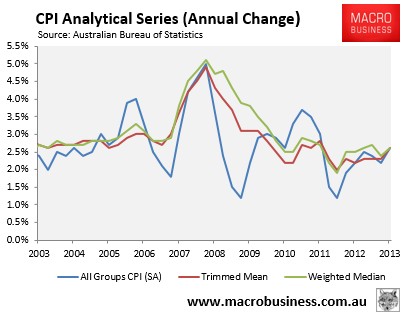
The ABS includes an ‘analytical series’, which provides alternative measures of underlying inflation in the economy. These measures – namely the trimmed mean and weighted median – aim not to measure the size of inflation (which is captured by the headline figure), but the breadth of price inflation across the basket of consumer goods and services.
The purpose of these measures is to exclude unusually large price movements (in both directions) of just a few of the subgroups, which may have quite an impact on the headline CPI. By excluding these outliers, you can get a feel for how widespread across the consumer basket inflation really is (see here for further details).
According to the ABS, the trimmed mean and weighted median measures differed from the headline result, both rising by 0.9 in the December quarter and by 2.6% respectively over the year – still around the middle of the RBA’s inflation target, but clearly on the rise (see below charts).
Finally, the below charts show CPI broken-out by tradables (mostly imports) and non-tradables (mostly services). As you can see, tradable inflation (circa 40% of the CPI basket) has barely shifted over the past decade or so – held down by the rising Australian dollar – whereas non-tradable inflation has grown strongly:
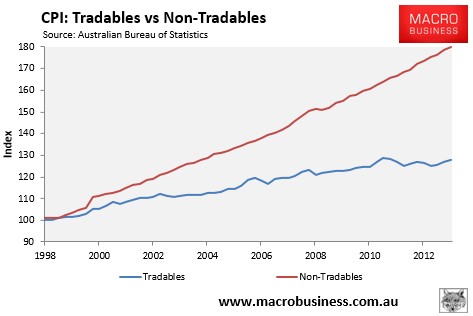
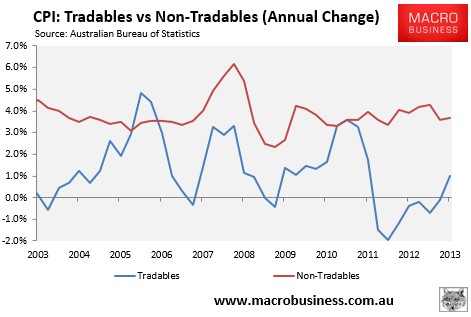
However, with the Australian dollar trending down, tradable inflation is clearly on the march, which will add to future inflationary pressures as the currency devalues.
In summary, inflationary pressures across the Australian economy are rising, although the headline, trimmed mean and weighted median CPI measures are still tracking within the RBA’s target band. The outlook is murky, however, with rising tradable inflation on account of the falling Australian dollar likely to be offset by a weakening domestic economy, with rising unemployment and excess capacity.
