
Yesterday the ABS released a revision to their methodology for seasonal adjustment to CPI subgroups – an outcome of the 16th Series CPI review. It resulted in a new lower estimate (not a revised estimate) of the trimmed mean and weighted median measures of inflation for the June quarter. News headlines and the foreign exchange markets seemed eager to interpret this as an excuse for the RBA to cut rates in the near future. I wouldn’t be so fast.
As I have said in the past, the CPI should be interpreted with a dose of caution. The RBA’s preferred measures of underlying inflation – the trimmed mean and weighted median – need a double dose of caution.
First, a summary of the actual change that occured (eager readers can tackle the whole ABS document here). Put simply, of the 90 subgroup price indexes that make up the CPI, 20 were seasonally adjusted in the 15th Series (Sept 2005 – Sept 2011), and now 64 will be seasonally adjusted in the 16th Series.
The graph below is taken from the ABS to show one of the subgroup indexes now receiving a seasonal adjustment in the CPI. It should be quite clear that while intra-year CPI estimates may vary, the year ended CPI figures with and without the seasonal adjustment would be very similar. Indeed, year-on-year estimates are within 0.1 percentage point at all quarterly readings since 2002.
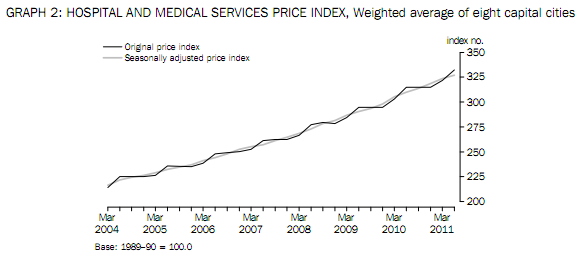
An increase in the scope of seasonal adjustments in the CPI was requested by the RBA in the 16th Series review, as they believed it better suited their needs for monitoring price inflation. The intra-year seasonality in the CPI can be seen in the graph below, with typically high March quarters, and typically low December quarters. The new seasonal adjustment methods soften this pattern, which means the RBA’s request appears justified.
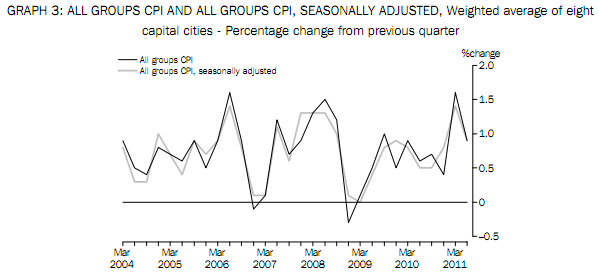
It all seems fairly mundane at this point. The media actually pounced on a very minor detail – the changes to the intra-year estimates of the RBA’s preferred measures of underlying inflation. The graphs below show these measures calculated using the old and new methods compared to the headline CPI.
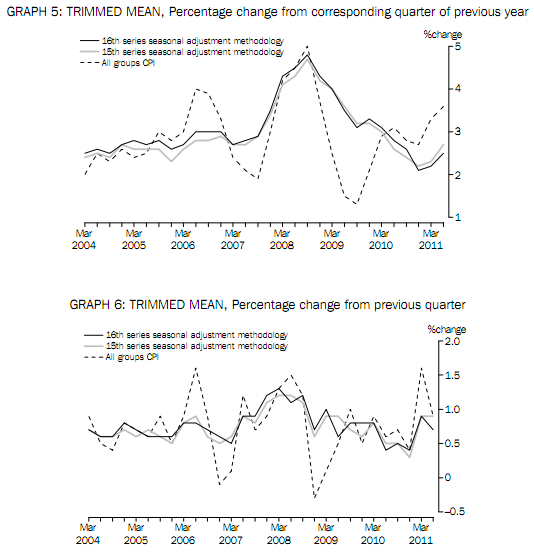
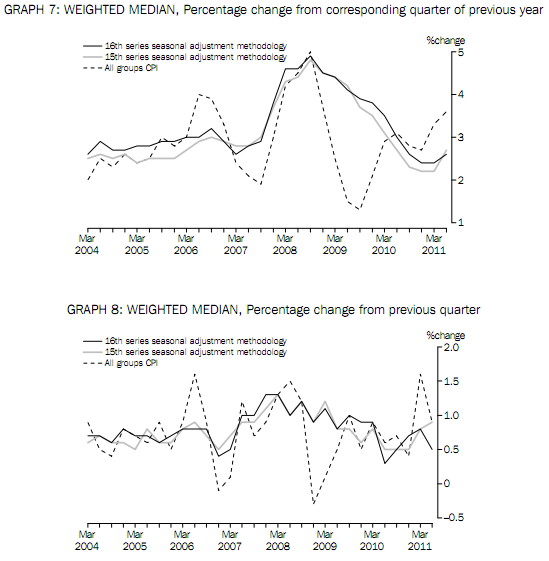
If we look very closely we can see in the lower to graphs the last quarter-on-quarter readings are lower when calculated with the new seasonal adjusments. The trimmed mean for the June quarter is 0.9% under the old measure and 0.7% under the new measure. The weighted median is 0.9% under the old measure and 0.5% under the new measure.
Remember, these are not revisions to the estimate, but new estimates using a different methodology. We can expect that the year-ended measures for both will be very similar (as they appear to be in the above graphs).
But what exactly are these ‘underlying’ inflations measures? What are they measuring if not inflation?
The short answer is that they aim not to measure the size of inflation, but the breadth of price inflation across the basket of consumer goods and services. Let us review the calculation of each measure in turn.
To calculate either measure you first rank the subgroups according the their price change over the quarter as shown in the below table. For the trimmed mean, you ‘trim’ (remove) the subgroups with the lowest prices moves, up to a 15% weight in the basket, and the trim the subgroups with the highest price moves up to a 15% weight. In the below table you can see all groups labelled (b) are removed from this calculation. The remaining 70% of the basket is then rescaled to be 100% of the basket, and the price change over the quarter of those remaining subgroups is multiplied by these weights to get a trimmed mean measure for the quarter. Simple enough?
The purpose of this measure is to exclude unusually large price movements (in both directions) of just a few of the subgroups, which may have quite an impact on the headline CPI. By excluding these outliers and using the middle 70% of price movements, you can get a feel for how widespread across the consumer basket inflation really is.
The weighted median has a similar purpose. This measure is easily calculated by ranking the subgroups in order of the price movements, then taking the price change of the subgroup that coincides with the 50% point in the cumulative basket weight. In the table above we can see that for the June quarter it happens to the change in the subgroup index for house repairs and maintenance. But it was very close to being the subgroup fish and other seafood, which would have given a 0.6% reading for the quarter instead of 0.5%.
Again, the weighted median is a good measure of breadth of price inflation across the subgroups in the consumer basket.
But these two measures are not particularly informative in isolation. They suffer from time lags with the headline measure. This occurs because price changes flow through the economy in particular ways following an expansion (or contraction) in the money supply – as any good Austrian economist would tell you. They also don’t chain together into a meaningful index, since they include different subgroups at each reading (although the ABS has now done this from 2002 onwards). For those still reading, it might be of interest to note that the trimmed mean has been the same as the headline CPI on average since 2002, while the weighted median has been a little higher on average (3.1% compared to 2.9%).
So what should markets think of this new measure?
Not much I would think. As you can see from the above graphs, not only are the quarterly estimates of underlying inflation quite volatile, the change in methodology does not show a consistent bias one way or the other. Put simply, if the June quarter measures are lower using the 16th series methodology, the September quarter measure is equally likely to be higher. Personally, I don’t think the RBA will read much into it. Especially considering how closely they have been involved with this particular change to the CPI. But given the political cloud under which the RBA operates, it is hard to tell what they might do. In any case, the September quarter CPI is released on 26 October.