Our recent Perth housing Members’ Report argued that Perth housing was the canary in the mine given the risks building for the Western Australian economy, including anticipated declines in both commodity prices and mining investment, which are likely to lead to sharply rising unemployment and falling income growth.
We then turned our focus to the Sydney housing report, which despite being Australia’s most expensive, is built upon relatively sound fundamentals, including tight supply, solid rental yields, and above-average jobs growth.
This was followed by an analysis of the Melbourne housing market, which is built upon far shakier foundations and is arguably Australia’s major market most at risk of a significant price correction once the current cyclical upswing ends.
Most recently, we turned our attention to Brisbane, where investment fundamentals and valuations continue to improve, thus representing a better-than-average proposition for investors.
This month, we turn our attention to Adelaide, where investment fundamentals are weak and the economy is deteriorating as the manufacturing sector struggles under the strain of the high Australian dollar, the State Government cuts jobs, and planned mining investments have been cancelled.
Valuations remain stretched:
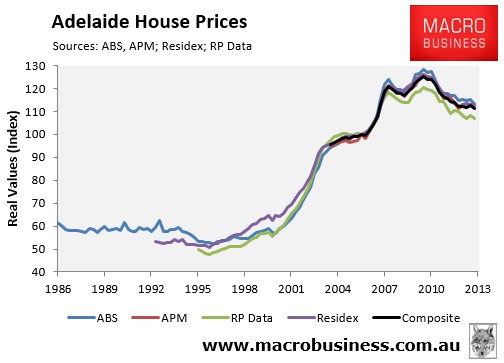
The evolution of Adelaide’s housing market is illustrated by the next chart, which tracks detached house prices, as reported by the four main housing data providers: the Australian Bureau of Statistics (ABS); Australian Property Monitors (APM); RP Data-Rismark; and Residex, as well as a composite measure, which is the average of these indices. The ABS has the longest running house price series for Adelaide, dating back to 1986, whereas APM’s is relatively new. Despite minor variations, all four series have tracked each other fairly closely (refer to our our first August Members’ Report for an explanation of how each house price series is constructed).
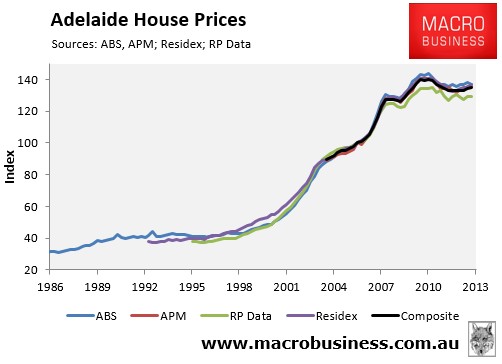
The September quarter price results for Adelaide revealed mixed fortunes for the housing market. RP Data (-0.9%) recorded price falls in the year to September 2013, whereas the ABS (+1.0%), APM (+2.6%), and Residex (+2.7%) recorded subdued growth, with prices also 3.7% below their 2010 peak when averaged out across the four data providers.
Residex and RP Data, which have released results to October and November respectively, paint a mixed picture with respect to Adelaide house prices. Whereas Residex recorded median price falls of 0.3% in October, RP Data recorded price rises of 0.4% and 1.5% respectively over October and November.
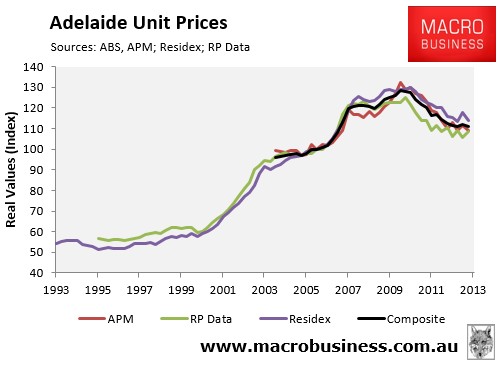
The recent price performance of Adelaide units has been lacklustre, with APM (+1.0%), RP Data (+0.3%) and Residex (+0.8%) each recording soft price growth in the year to September 2013, with prices also 6.5% below their 2010 peak when averaged-out across the four data providers (see next chart).
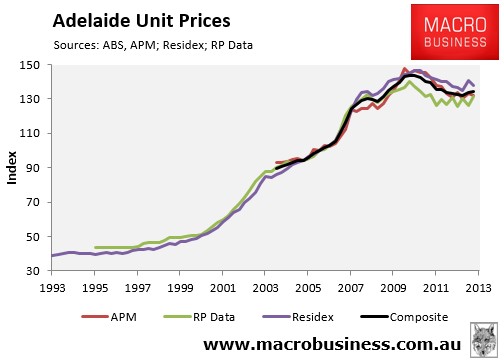
Results to October and November, released by Residex and RP Data, paint a mixed picture for the Adelaide unit market. While Residex reported 2.5% growth in October, RP Data reported falls of 0.9% and 1.8% respectively in October and November.
The next chart plots Adelaide house prices in real inflation-adjusted terms. According to this chart, house prices in Adelaide rose by between 110% and 130%, depending on the index, in the eleven years to 2010, but have since declined by around 14% when averaged out across the four data providers.
Adelaide unit prices have performed in a similar manner in real inflation-adjusted terms, with prices also down nearly 13% since peak, when averaged out across the four main data providers (see next chart).
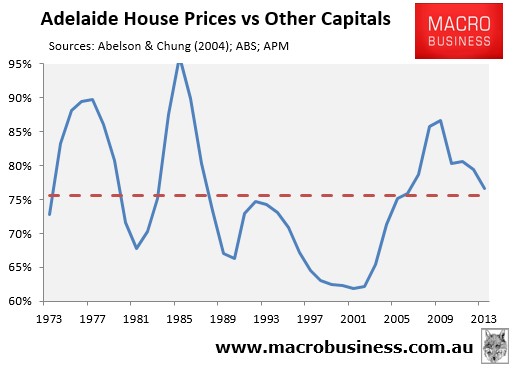
Despite the correction in Adelaide home prices, valuations remain stretched. The next chart, which compares Adelaide’s median house price against the average of the other capital cities, shows that a typical house in Adelaide is currently valued at 77% of the average of the other capitals, which is just above its long-term average of 76%:
The supply picture is mixed and rental returns are mediocre:
The construction of dwellings in South Australia has been high when compared to the other mainland capitals. In the decade to March 2013, South Australia built 107,956 dwellings for a 148,886 increase in the population, representing a population-to-construction ratio of 138%. This compares to a population-to-construction ratio of 219% for the nation as a whole over the same period.
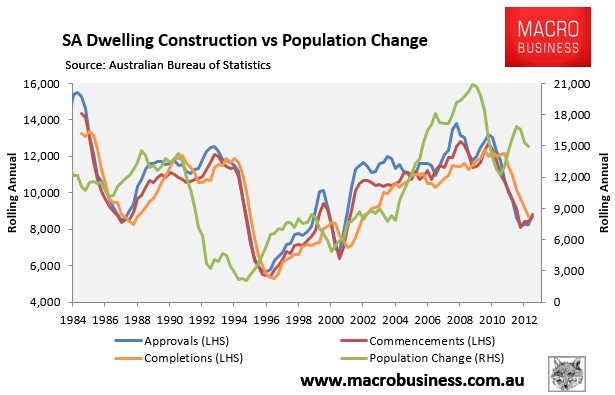
However, as shown above, South Australia’s dwelling construction has slumped recently just as population growth has begun to accelerate, suggesting that Adelaide’s housing supply could soon begin to tighten.
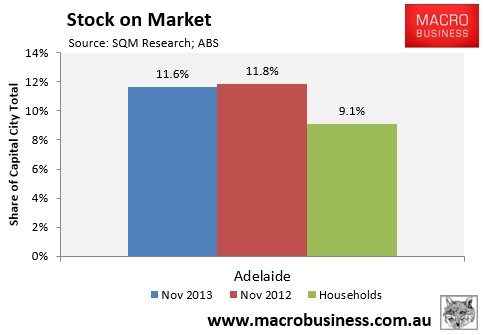
The number of homes listed for sale in Adelaide is also relatively elevated. While total listings have declined by 5.3% over the past year, from 18,767 for sale listings in November 2012 to 17,776 as at November 2013, listings remain elevated, with Adelaide accounting for 11.6% of national capital city for sale listings in November 2013, which was well above its 9.1% share of Australian capital city households (see next chart).
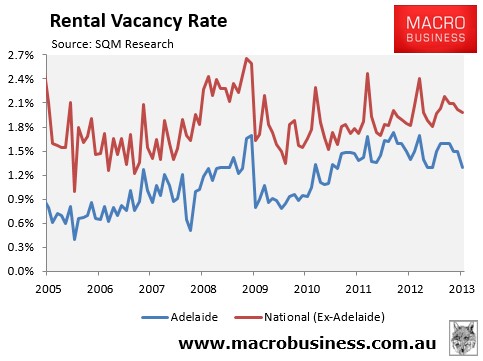
Adelaide’s rental vacancy rate has trended upwards since late-2009, although it has taken a dip recently. Further, at only 1.3%, Adelaide’s rental vacancy rate remains well below the other capitals (2.0%), suggesting that Adelaide’s rental market remains relatively tight (see next chart).
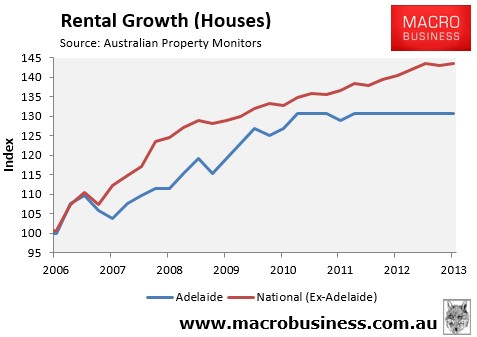
Nevertheless, rental growth in Adelaide has been relatively sluggish. Gross house rents in Adelaide have grown by only 31% since March 2006, compared with 44% rental growth in the other capitals (see next chart).
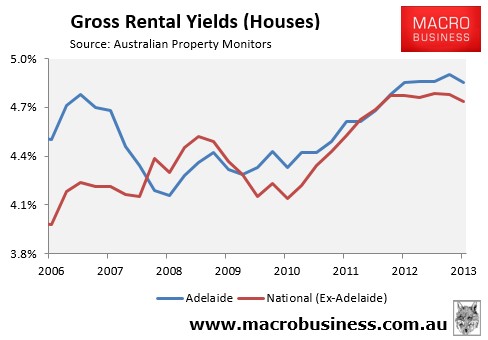
Adelaide’s slower rental growth has also suppressed rental yields. Adelaide’s median gross house rental yield of 4.9% is only slightly above the other capitals (4.7%), as are gross unit rental yields (i.e. 5.2% in Adelaide versus 5.1% in the other capitals). This makes Adelaide housing a lukewarm investment proposition from an income perspective.
Mortgage demand has picked-up:
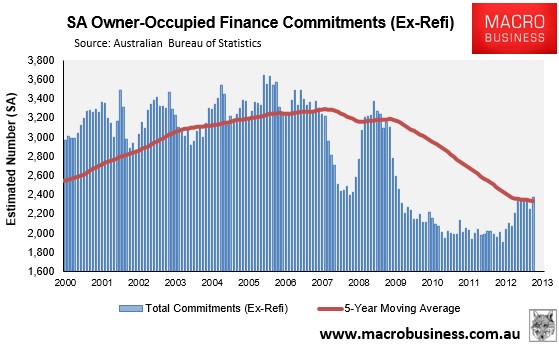
Mortgage demand has picked-up significantly in South Australia, with the total number of owner-occupied housing finance commitments (excluding refinancings) increasing by a seasonally-adjusted 21% in the year to September 2013 to be tracking just above the five-year moving average (see next chart).
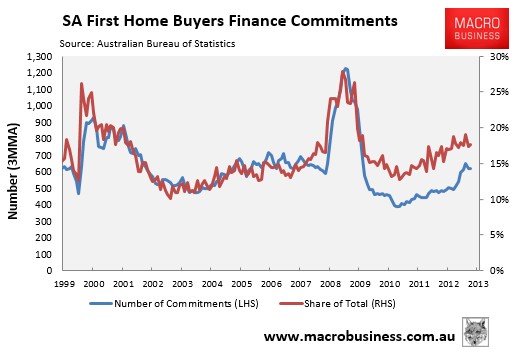
Importantly, demand from first home buyers in South Australia has held-up quite well. The number of first home buyer mortgage commitments rose by 28% in the year to September 2013 and was tracking only 2% below the five-year moving average. Similarly, the share of total finance commitments going to first home buyers was 18% in September, which was in-line with the five-year moving average (see next chart).
However, South Australia is set to follow the other major states in removing the First Home Buyers’ Grant on pre-existing dwellings from 1 July 2014, which should lead to a sharp drop in demand from this segment, as has occurred in New South Wales, Queensland, and Victoria after the removal of their Grants.
Adelaide’s economy is weak:
Adelaide’s economy and employment market has weakened significantly.
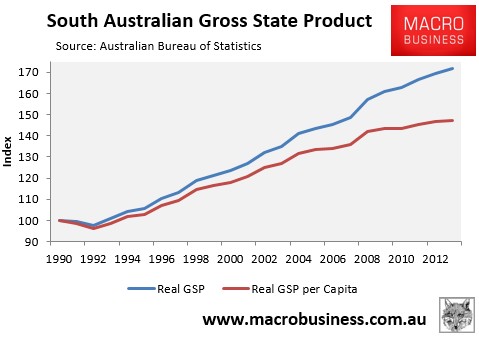
The growth of South Australian real gross state product (GSP) was only 1.3% in the year ended 30 June 2013, which was the weakest result out of the mainland states and territories. In per capita terms, the South Australian economy experienced the second weakest GSP growth on the mainland, coming in ahead of Victoria, with the economy expanding by only 3.6% in per capita terms since June 2008 (see next chart).
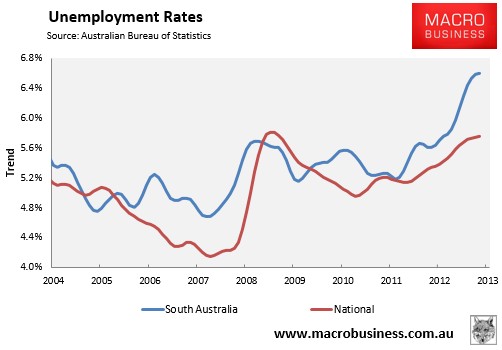
Similarly, labour force statistics published by the Australian Bureau of Statistics shows that the employment situation in South Australia has deteriorated sharply. The unemployment rate in South Australia stood at 6.6% in trend terms in October 2013, which was well above the national average of 5.8% (see next chart).
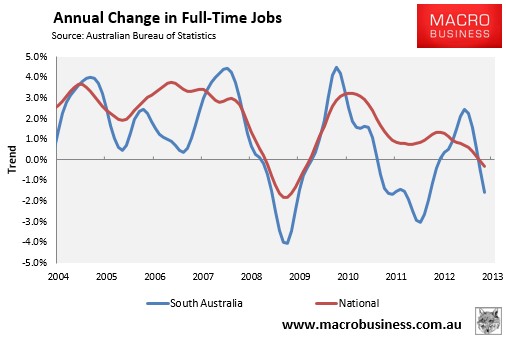
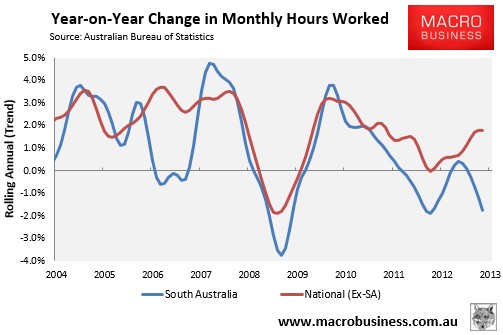
More worryingly, South Australia has experienced the mainland’s sharpest falls in the number of full-time jobs and the aggregate number of hours worked, which is even more indicative of the state’s labour market weakness (see below charts).
Last year’s indefinite deferral of the $30 billion Olympic Dam project by BHP dealt a significant blow to the state’s economy. The South Australian Budget had estimated that the project would create up to 6,000 new jobs during construction, a further 4,000 full-time positions at the expanded open pit mine, and an estimated 15,000 new indirect jobs, none of which will now proceed.
Treasury modeling also revealed that the deferral of the project could forgo some $1.1 billion of economic activity in the state over the next three years.
The announced closure of the Holden manufacturing facility in Elizabeth by 2017 represents another major setback for the South Australian economy. A detailed study by the University of Adelaide estimated that the facility’s closure would decrease economic activity in the state by $1.2 billion and reduce employment by 13,200 jobs (1.6%).
The ratings agencies have also fired warning shots at the South Australian Government. In September last year, Standard & Poor’s downgraded South Australia’s credit rating by one notch to AA and in October 2013 ranked the state’s budgetary performance as “among the weakest in Australia”. Meanwhile, Fitch downgraded South Australia’s credit rating in September 2013, citing the state’s large debt and deficit positions as reasons for investors to be cautious.
The South Australian Government is already making concerted efforts to reign in the Budget deficit. In its Mid-Year Budget Review, released earlier this month, the Government noted that full-time equivalent employment in the general government sector would be cut by 3,815 between 30 June 2013 and 30 June 2017.
Any further hit to revenues risks creating a positive feedback loop, as the Government is forced to make deeper cuts to public sector spending and jobs in order to safeguard the State’s credit rating, potentially placing further downward pressure on the already weakening economy.
Bottom Line:
Adelaide’s housing fundamentals are relatively weak, with valuations remaining stretched and unenticing rental returns on offer. And while mortgage demand has picked-up significantly over the past year, it risks slowing once the FHOG on pre-existing dwellings is cancelled on 1 July 2014.
The South Australian economy is also fragile, with gross state product slowing sharply over the past year, and the economy losing a significant number of jobs.
Risks are also building for the South Australian economy. On top of the deferral of the Olympic Dam project by BHP last year, Holden’s announced closure in 2017 risks dealing a further blow to jobs and growth. These downside risks are exacerbated by the State Government’s intended cuts to public sector jobs in a bid to return the Budget to surplus and protect the State’s credit rating.
————————————————————————————————————————————–
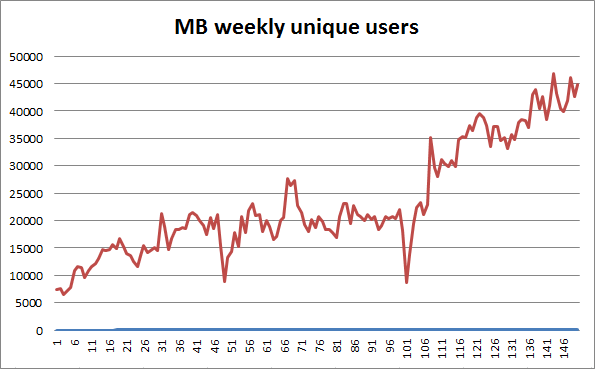
Aaand, here’s your MB traffic update for December which the technicians among you will notice is forming an ascending triangle auguring an upside breakout!