

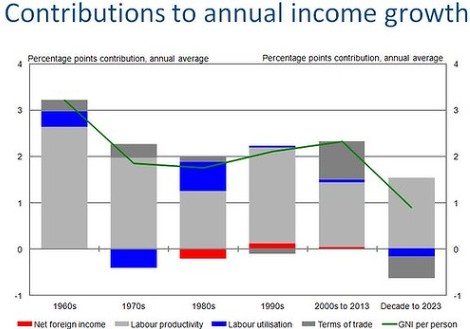
As noted earlier today by Houses & Holes, the head of the Macroeconomics Group at the Australian Treasury, David Gruen, today forecast that average per capita income growth will halve over the next decade to the lowest rate of growth experienced in 50 years (see next chart).
While the key reasons behind the expected fall in income growth will be familiar to regular readers of MacroBusiness, since it is something that we have been warning about for an extended period of time, I thought I’d provide a quick refresher for the benefit of our newer readers.
The first reason for the forecast decline in incomes is the unwinding of the once-in-a-century commodity price boom and Australia’s terms-of-trade.
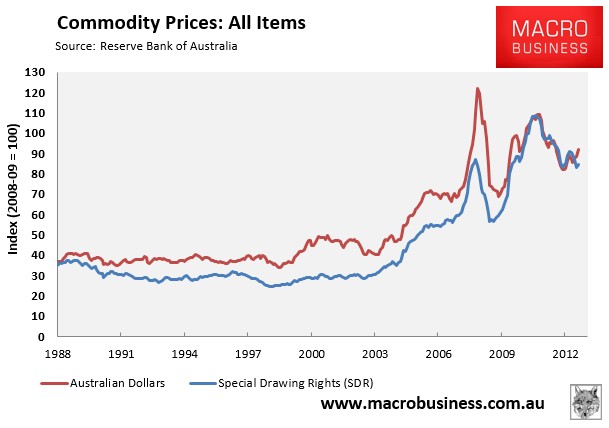
From 2003, Australia experienced the biggest commodity price boom in the nation’s history, whereby the prices received for our biggest exports – iron ore, coal, LNG, and gold – literally exploded (see next chart).
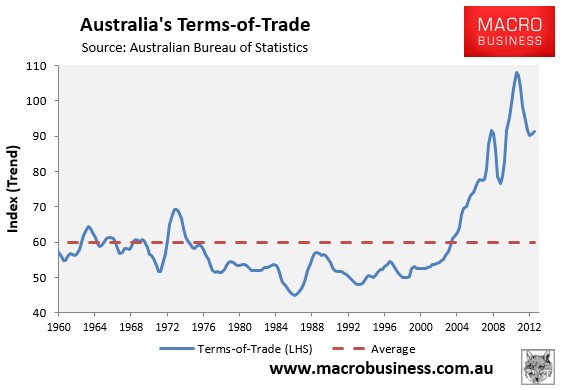
This boom caused the terms-of-trade – essentially the price received for Australia’s exports divided by the price paid for imports – to surge to the highest level on record (see next chart).
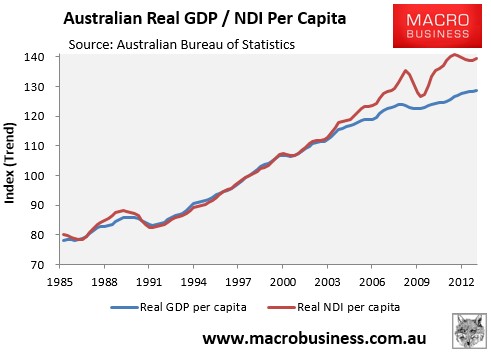
Essentially, Australia received a large pay rise, since it could now buy more imports from a given level of exports. In turn, this pay-rise meant that Australia’s national disposable income (NDI) grew at a much faster rate than output, as measured by GDP, making Australians much wealthier (see next chart).
These facts are acknowledged in the first chart above from the Australian Treasury, which estimates that around 40% of the growth in average incomes between 2000 and 2013 was caused by the rise in Australia’s terms-of-trade.
As shown below, this surge in NDI also flowed to Australian households. As you can see, real income growth remained relatively stagnant in the 1980s, grew solidly in the 1990s as microeconomic reforms boosted productivity, grew even more strongly over the 2000s as the terms-of-trade boost kicked-in, and have since slowed down over the past three-and-a-half years:
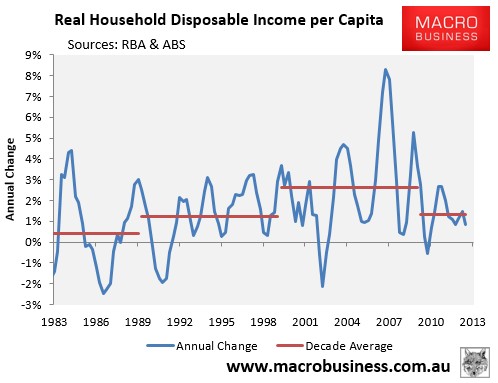
While the surge in incomes over the 2000s was extraordinary, growth will be much slower going forward as the terms-of-trade continues to retrace back towards its longer-term average level, detracting from household income growth in the process.
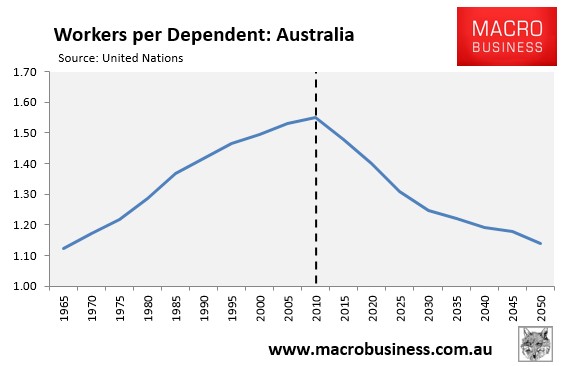
The second major structural headwind for incomes identified by Treasury is Australia’s ageing population. The withdrawal of the large baby boomer cohort from the workforce will result in a rising dependency ratio and a falling share of workers supporting non-workers (see next chart).
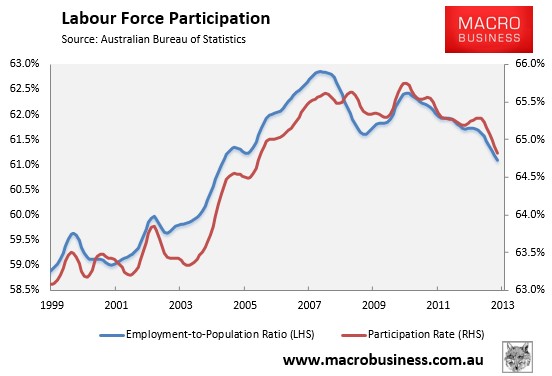
In turn, the labour force participation rate and the employment-to-population ratio is likely to continue trending lower (see next chart), lowering growth in both GDP and national income.
These are two of the major structural headwinds facing the Australian economy, are are the key factors behind Treasury’s pessimist income growth forecasts.
