The Australian Bureau of Statistics (ABS) has released its 2012-13 Australian System of National Accounts (ASNA) data release, which provided a detailed presentation of annual national accounts data.
Locked away on Table 61 was my favourite section of the release: data on aggregate land values at the state and national levels. This years release confirmed that, at a national level, the land values underpinning the Australian house prices rebounded after two consecutive years of decline, with all states and territories recording growth in nominal terms but at differing rates.
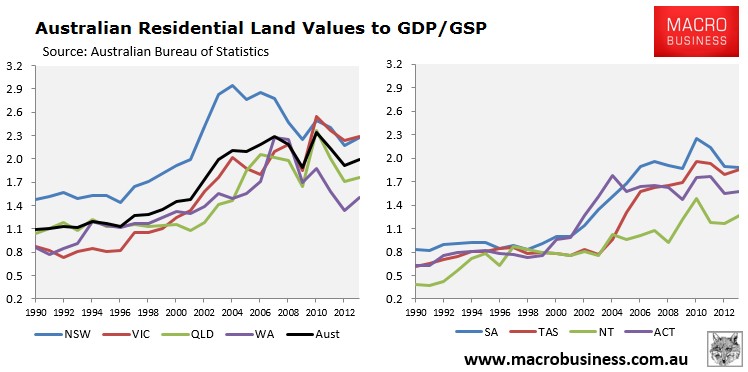
The release yesterday of the annual state accounts by the ABS has enabled me to calculate residential land values as a percentage of gross state product (GSP), which provides a measure of relative valuation as well as potential over-under valuation.
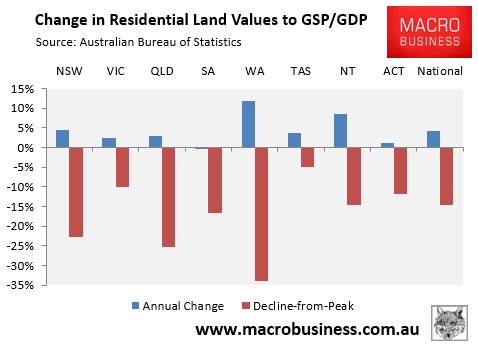
As shown in the next chart, residential land values to GSP grew in all states and territories in the year to June 2013, with the exception of South Australia, where growth was flat. However, values remain below their peak across all jurisdictions, with values heavily underwater in New South Wales (-23%), Queensland (-25%) and Western Australia (-34%).
Looking at the time series, you can see that New South Wales and Victoria are tied for the most expensive residential land, although both are below the nose-bleed levels reached in 2004 in New South Wales (2.9 times GSP):