On Friday, the Australian Bureau of Statistics (ABS) released its 2012-13 Australian System of National Accounts (ASNA) data release, which provides a detailed presentation of annual national accounts data.
Locked away on Table 61 is my favourite section of the release: data on aggregate land values at the state and national levels. This years release confirms that, at a national level, the land values underpinning the Australian house prices rebounded after two consecutive years of decline.
The below chart summarises Australia’s aggregate land values by use relative to Australia’s gross domestic product (GDP) since 1989, which is as far back as the data goes:
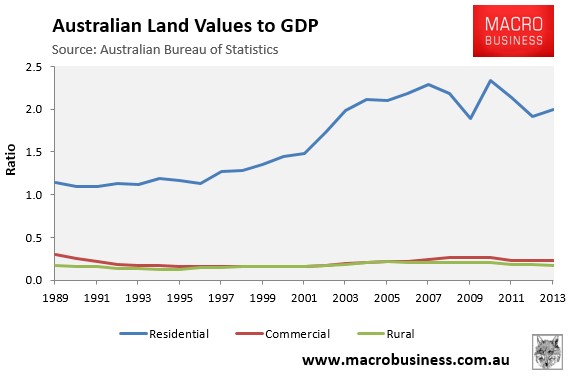
Whereas aggregate Australian Commercial and Rural land values have remained fairly stable over the past 24 years relative to GDP, residential land values skyrocketed, rising from 1.1 times GDP to a peak of just under 2.4 times GDP in 2009-10. Australian residential land values then deflated to 1.9 times GDP over the following two years before reflating to 2.0 times GDP currently.
When the aggregate residential land values data is combined with the Reserve Bank of Australia’s (RBA) dwelling values data – which combines both residential land values and structures (buildings) – it becomes clearly evident that the uplift in Australia’s housing prices over the past 20 years is due almost entirely to increasing land values, rather than higher building costs (see below chart).
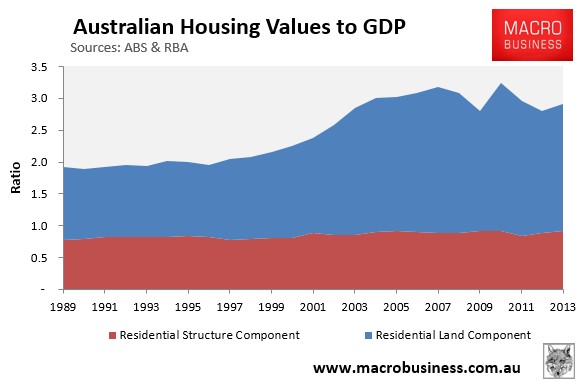
Whereas the structure values to GDP – calculated by deducting the ABS’ residential land value figures from the RBA’s dwelling assets data – was 0.82 times GDP in 1988-89, it is only 0.92 times times GDP currently and has remained fairly stable throughout the entire 24-year period.
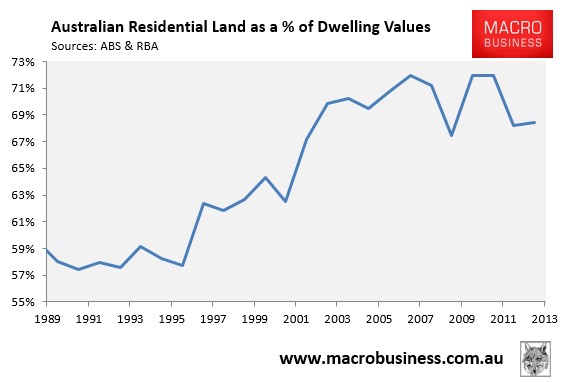
Reflecting the fact that residential land has risen in value relative to buildings, the land component of Australia’s housing stock rose from a low of 57% in 1991-92 to a peak of 72% in 2009-10, and now sits at 68%:
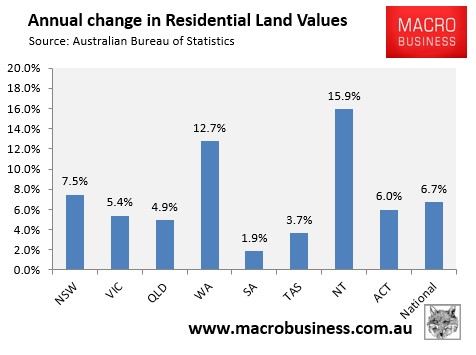
The below chart tracks the growth of nominal residential land values at the state and territory level since 1988-89:
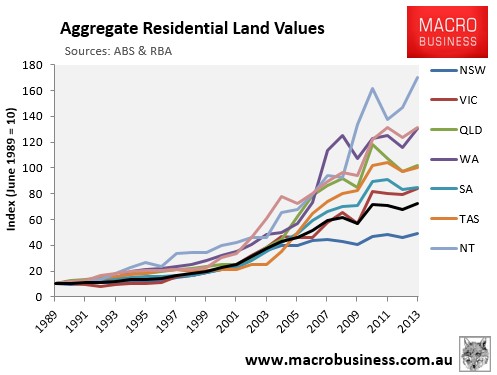
The rebound in residential land values in 2012-13 was broad-based, with all states and territories recording growth in nominal terms but at differing rates (see next chart):