

As summarised earlier, the Australian Bureau of Statistics (ABS) today released labour force data for the month of October, which registered a 0.1% seasonally-adjusted increase in the headline unemployment rate to 5.7%. The resultwas in line with analysts’ expectations.
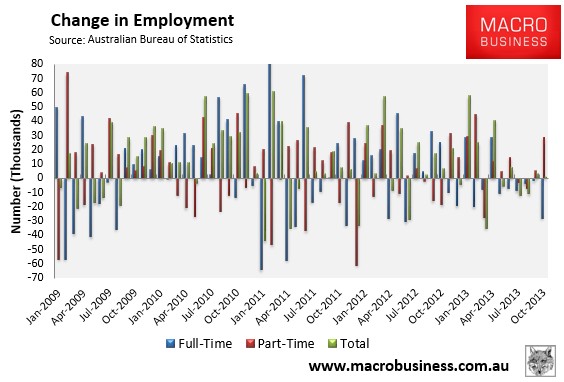
Total employment rose by a seasonally adjusted 1,100 jobs, with full-time jobs falling by 27,900 to 8,094,700 and part-time employment increasing 28,900 to 3,544,500. However, aggregate monthly hours worked rose by 6.2 million hours to 1,648.5 million hours.
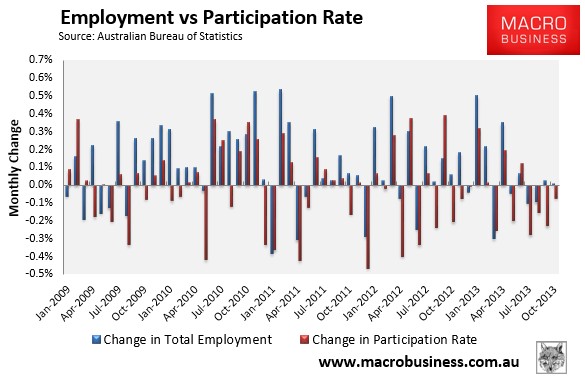
The participation rate also remained steady at 64.8% following a downward revision to the September estimate (previously 64.9%).
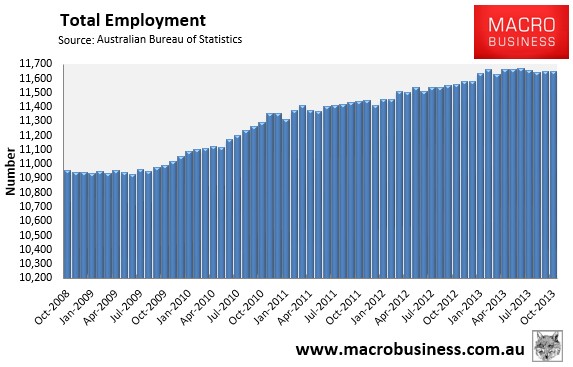
Total employment has essentially flatlined since the beginning of the year (see next chart).
With all jobs growth part-time (see next chart):
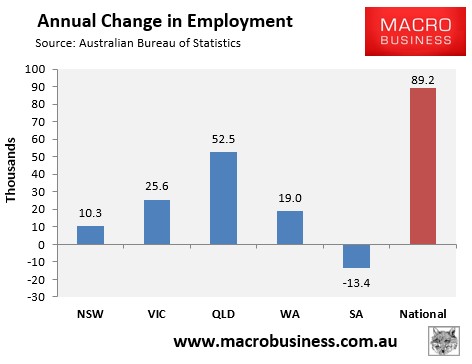
All mainland states, except South Australia, have added jobs over the year (see next chart).
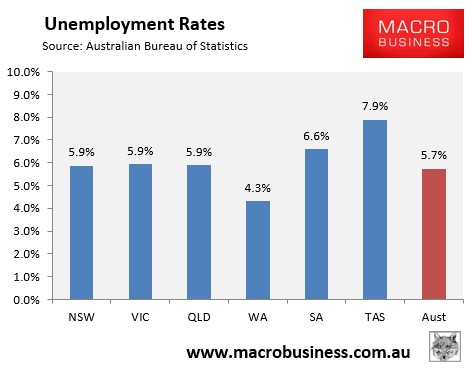
And the variance of unemployment rates across the nation is also fairly narrow, with Western Australia and Tasmania the clear outliers (see next chart).
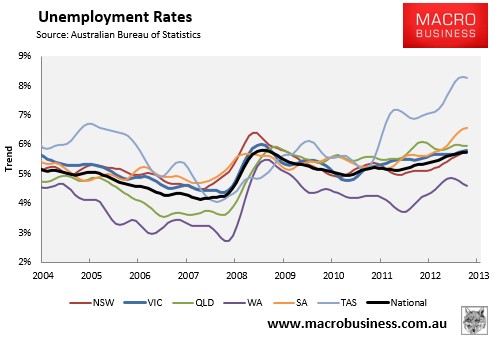
The state seasonally-adjusted figures are notoriously volatile and subject to a big margin of error. As such, the below chart shows the ABS’ trend unemployment rates, which shows Western Australia with the lowest unemployment, Tasmania and South Australia with the highest, and the others bunched together around the national average:
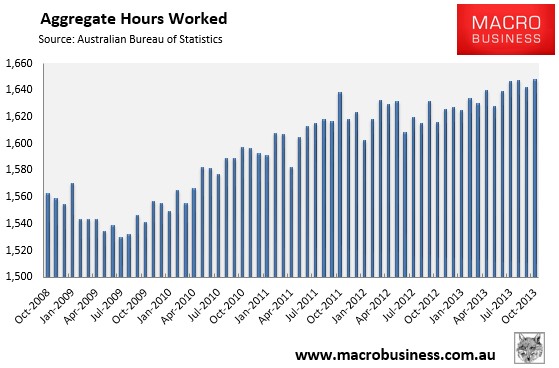
A positive from this release is that the aggregate number of hours worked rose by 0.4% nationally in October and is up by 2.0% over the year:
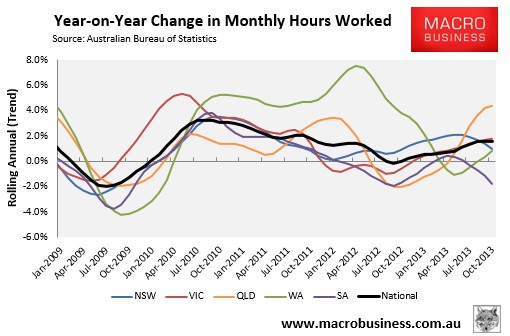
The below chart, which tracks the changes in hours worked on a trend basis, shows a mixed bag, with Western Australia’s labour market recovering, Queensland’s looking strong, New South Wales’ softening, and South Australia’s remaining very weak:
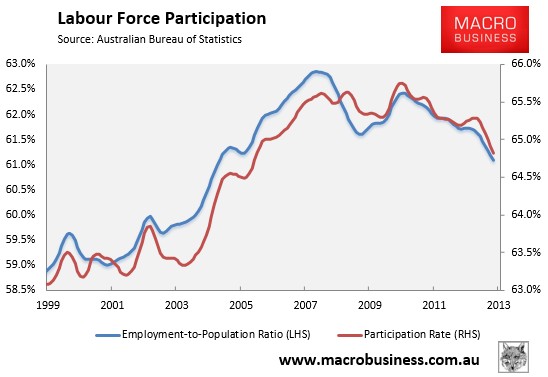
The weakening labour market, combined with Australia’s aging population, has seen the employment-to-population ratio fall to its lowest level in 8.5 years in trend terms (see next chart).
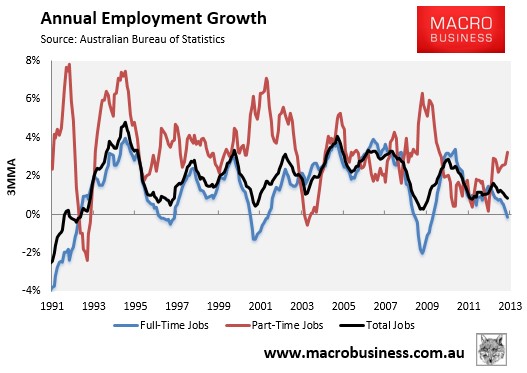
And to wrap up, the below chart summarises the annual change in the key employment aggregates:
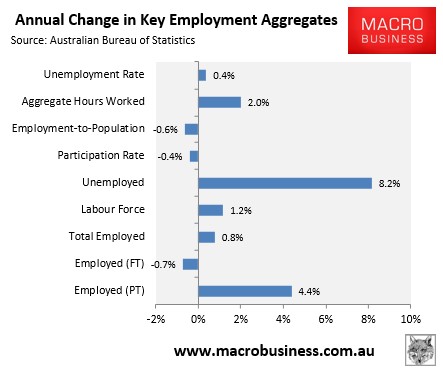
Overall, you can see from the above chart that the Australian labour market remains soft, with jobs growth still well below the level required to absorb population growth (with all of the growth in employment over the past year part-time), and both the employment-to-population ratio and participation rate continuing to trend down. On the other hand, growth in aggregate hours worked remains solid, which suggests that there could be some pent-up labour demand.
unconventionaleconomist@hotmail.com
