David Uren has a useful emphasis today on a statistic that passed the nation by last week without enough comment. Weak wage growth:
The 2.7 per cent rise in the wage index over the past year barely matched the 2.2 per cent rise in consumer prices and was the lowest rate of annual growth since the global downturn in 2000.
The 0.5 per cent increase in the September quarter was also the second lowest since the index was first developed by the Australian Bureau of Statistics in 1997, with the only weaker quarter having been a 0.4 per cent rise in the depths of the global financial crisis.
The return to earth of the mining industry provides a partial explanation. A year ago, it was still delivering outsized wage rises, with the average increase across the industry reaching 5.2 per cent, but it has now come back down to 3.2 per cent.
Utilities, led by the gas sector, were also paying big increases a year ago, with an average increase of 4.4 per cent, and that has also fallen sharply to 3.4 per cent.
However, wage growth has fallen across all 18 industry sectors tracked in the survey. A year ago, 10 sectors had wage growth of 3.5 per cent or more. Now there are none. A year ago there were three industries with average wage increases of less than 3 per cent, while there are now 12. The slowdown is equally evident in both public and private sectors.
Uren notes that the Phillips Curve indicates we should be seeing wage inflation still at around 3.4%. The Phillips Curve posits a simple relationship between the unemployment rate and the rate of wage increases. As I’ve noted before, the Phillips Curve has been a pretty reliable model for Australia but no longer it seems.
Uren also highlights that The Reserve Bank has been exploring these issues and lists a number of reasons for the dislocation:
elevated job insecurity
retiring baby boomers
poor job skills matching under structural adjustment conditions and discouraged unemployed
low inflation expectations
These contribute to a lower participation rate, which has fallen as much as it did in the 1993 recession, even if unemployment has not risen anywhere near as far.
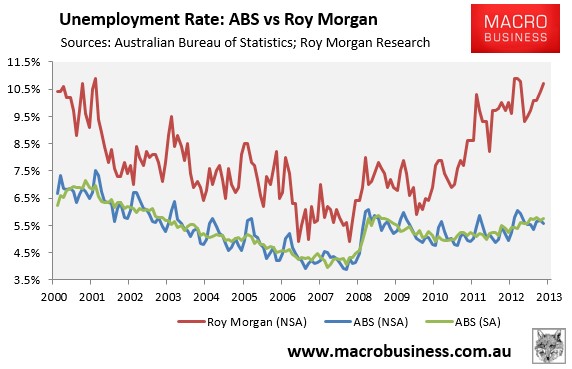
For me, the mystery is solved by looking at the following chart:
The Roy Morgan measure of unemployment is MUCH higher than the ABS version. This is because Roy Morgan counts underemployment in its measure whereas the ABS considers you employed if you worked one hour per month.
I apply a little common sense and personal experience at this point. I know a lot of companies that reduce hours rather headcount when times require it. The memory of skills shortages is still fresh for many companies and it as well appeals to Australian values to cut hours rather than people. We are much less cut throat about job losses than the US culture. The old egalitarian streak, not mention spirit of voluntarism, is alive and well.
It’s a pragmatic system rather than a formal one like Germany’s kurzabeit but it achieves the same end. It also hints at some industrial relations truths that are rarely canvassed: the existing system is flexible in its own way irrespective of varying political narratives; it helps support high asset prices by preventing forced sales and, although it is early days, kuzabeit has so far proved able to deflate wages growth to improve competitiveness as well.
Of course one could argue as well that it will slow creative destruction and therefore productivity growth and that’s probably true. But it won’t stop it and so may actually offer benefits in a more efficient transition for workers from a dying sector to a thriving one because they have time to adapt skills. The RBA noted something of this nature using economist gobbledygook in the most recent SoMP:
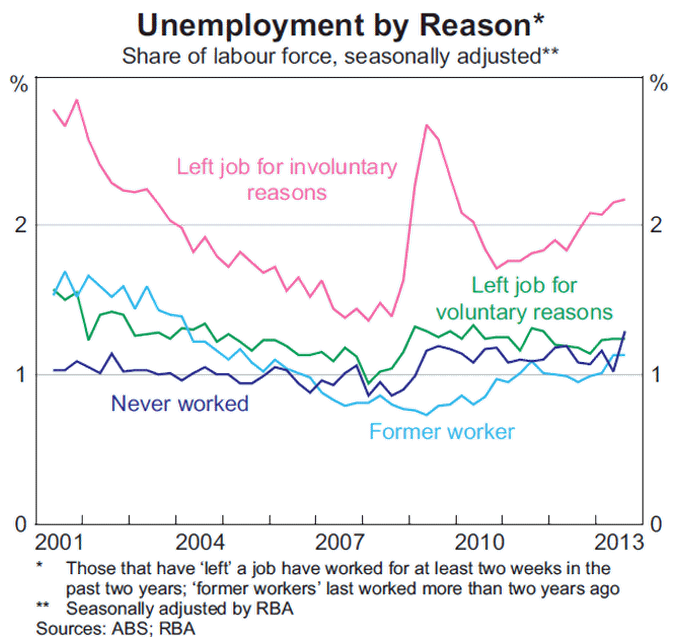
It is difficult to assess the extent to which such structural factors have contributed to the recent rise in unemployment. The rate of long-term unemployment (measured as the share of the labour force that has been unemployed for more than a year) has risen only slightly in recent years. Rather, most of the increase in the unemployment rate has been attributable to individuals that have been unemployed for between 4 and 52 weeks, who are more likely to be unemployed for cyclical reasons. Looking at the reasons reported for unemployment, most of the increase in unemployment can be attributed to unemployed persons that have left their job involuntarily in the past two years, with a large proportion of such job losses likely to occur for cyclical reasons (e.g. retrenchment or business closure). Since mid 2011, persons unemployed for reasons that are most likely to relate to structural unemployment – namely, ‘former workers’ (those whose last full-time job was more than two years ago) and those that have never worked before – have made only modest contributions to the aggregate increase in unemployment. However, as the former worker measure of unemployment largely relies on the last period of employment having been at least two years ago, it would demonstrate a change in structural unemployment only with a lag. Both measures are also likely to capture some share of workers who are unemployed for cyclical rather than structural reasons.
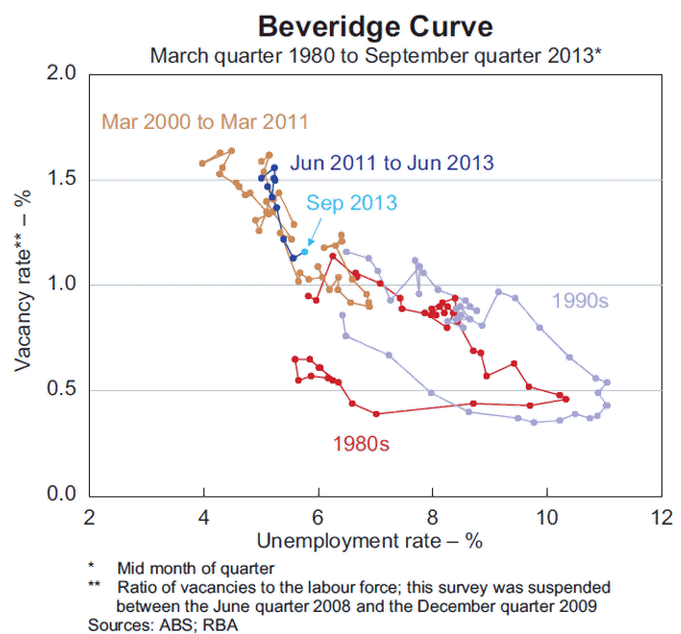
Changes in the relationship between unemployment and job vacancies, as shown by the Beveridge curve, provide another way of assessing the level of frictional and structural unemployment. Movements along the (downward sloping) Beveridge curve will generally reflect cyclical changes in labour market conditions; for instance, a decline in the demand for labour results in a decrease in the number of vacancies (as a share of the labour force), as firms search for less labour, and so an increase in the unemployment rate. In contrast, changes to the rates of frictional and structural unemployment will show up as outward or inward shifts in the position of the Beveridge curve; that is, for a given vacancy rate the unemployment rate is either higher or lower. The significant decline in the vacancy rate since mid 2011 has coincided with a smaller increase in the unemployment rate than the average historical relationship would have indicated. While this may be a function of the noise that naturally exists in this relationship, it may also be consistent with labour market matching having become slightly more efficient over this period.
No, the Beveridge Curve is not a beer goggles index that shows the relationship between the number of drinks consumed to the relative attractiveness of women. It’s a measure of the efficiency of skills matching in the labor market for the unemployed and is some evidence that Australian kurzabeit my offer efficiency as well as equity.
I suspect the real test for Australian kurzabeit lies ahead not behind. If a real depreciation of wages is needed to restore our competitiveness as we head over the mining cliff, as Professor Garnaut suggests, then the heat will be on our friendly little system.
David Llewellyn-Smith is Chief Strategist at the MB Fund and MB Super. David is the founding publisher and editor of MacroBusiness and was the founding publisher and global economy editor of The Diplomat, the Asia Pacific’s leading geo-politics and economics portal.
He is also a former gold trader and economic commentator at The Sydney Morning Herald, The Age, the ABC and Business Spectator. He is the co-author of The Great Crash of 2008 with Ross Garnaut and was the editor of the second Garnaut Climate Change Review.