
The nascent weakness hitting the US housing market, alluded to yesterday by Houses and Holes, is yet to show up in the the 20-city Case-Shiller house price index, which registered strong 0.9% seasonally adjusted growth in August to be up 12.8% over the year – the strongest annual growth rate since February 2006 (see next chart from Calculated Risk).
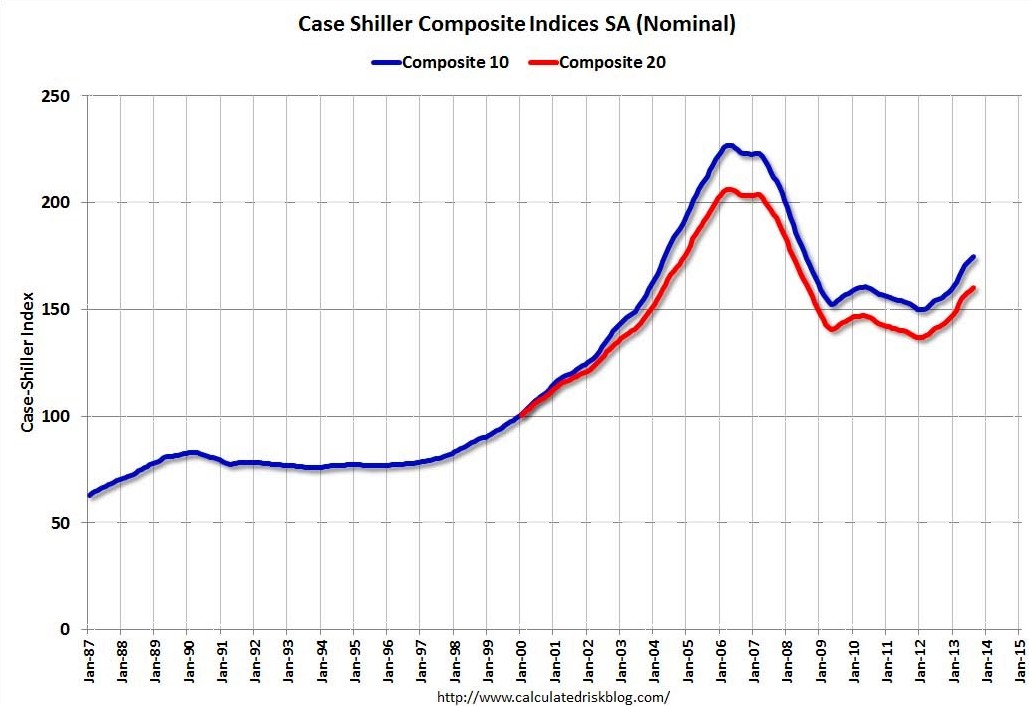
The strong result in August, which flies in the face of recent agent reports, asking prices, pending home sales, and consumer sentiment – all of which show a weakening trend – can be explained by the reporting lag and because of the three month average used in the Case-Shiller index (the August report was an average of June, July and August prices).
As such, it is probably reasonable to assume that we will see a deceleration of year-on-year price growth going forward and the prospect of some significant deceleration in prices towards the end of the year and into 2014.
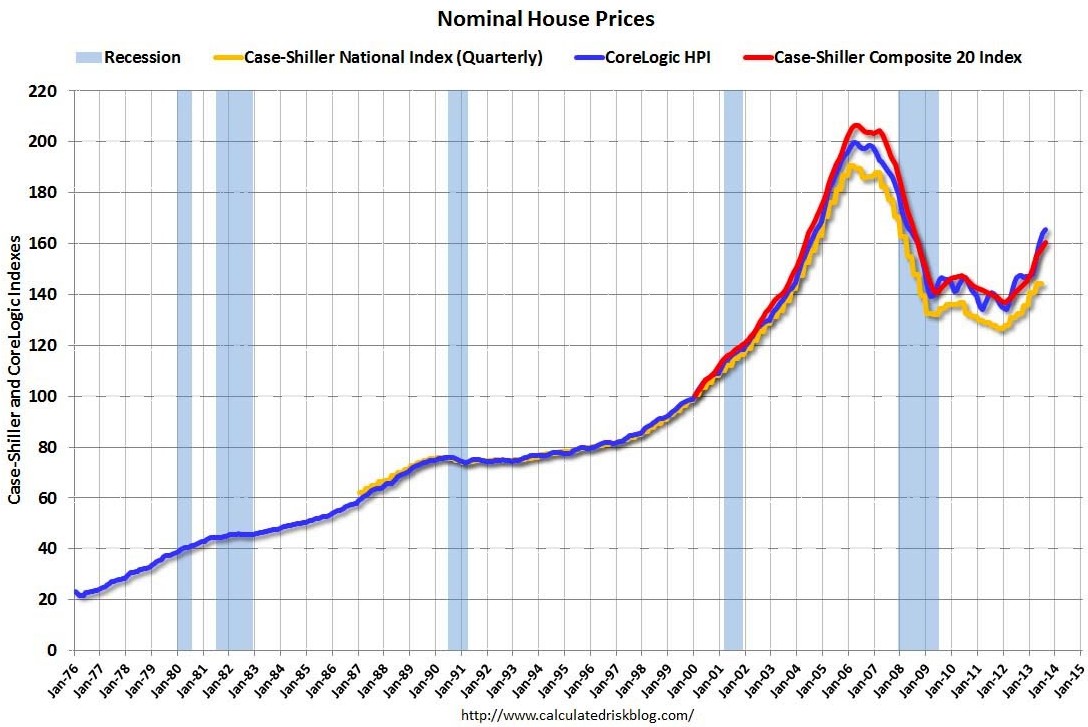
The below charts, which come from Calculated Risk, show the state of play in US house prices.
First, nominal house prices, as measured by Case-Shiller and Core Logic, show that values are back at 2004/04 levels:
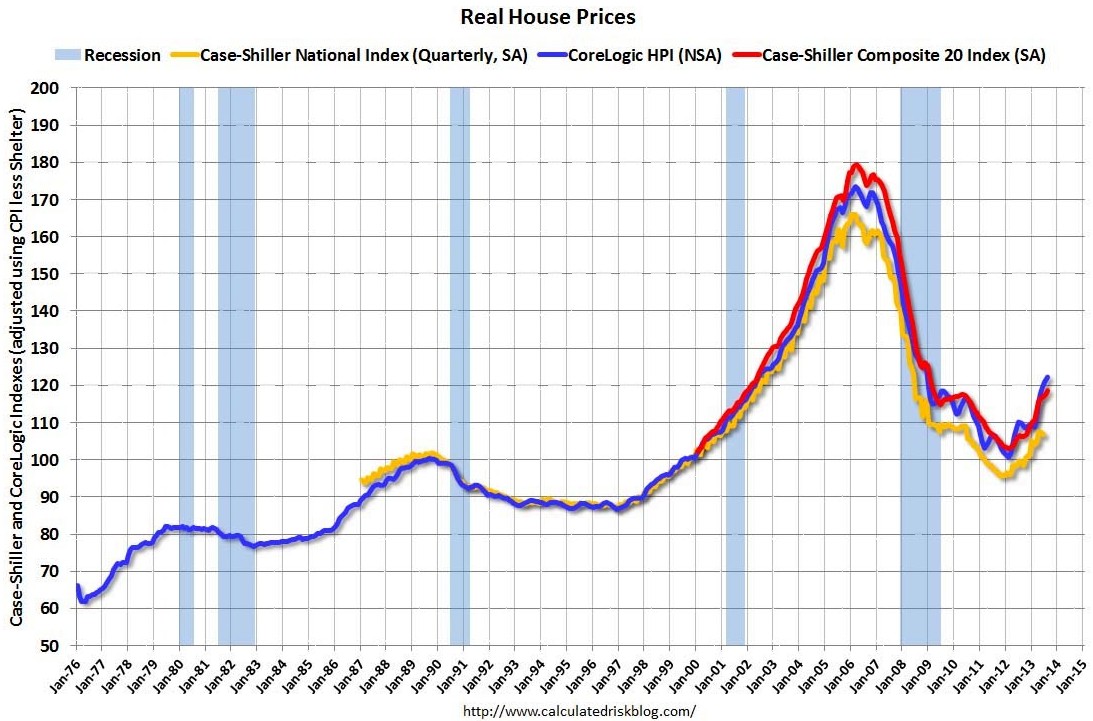
In real terms, US house values are back at early-2000 levels:
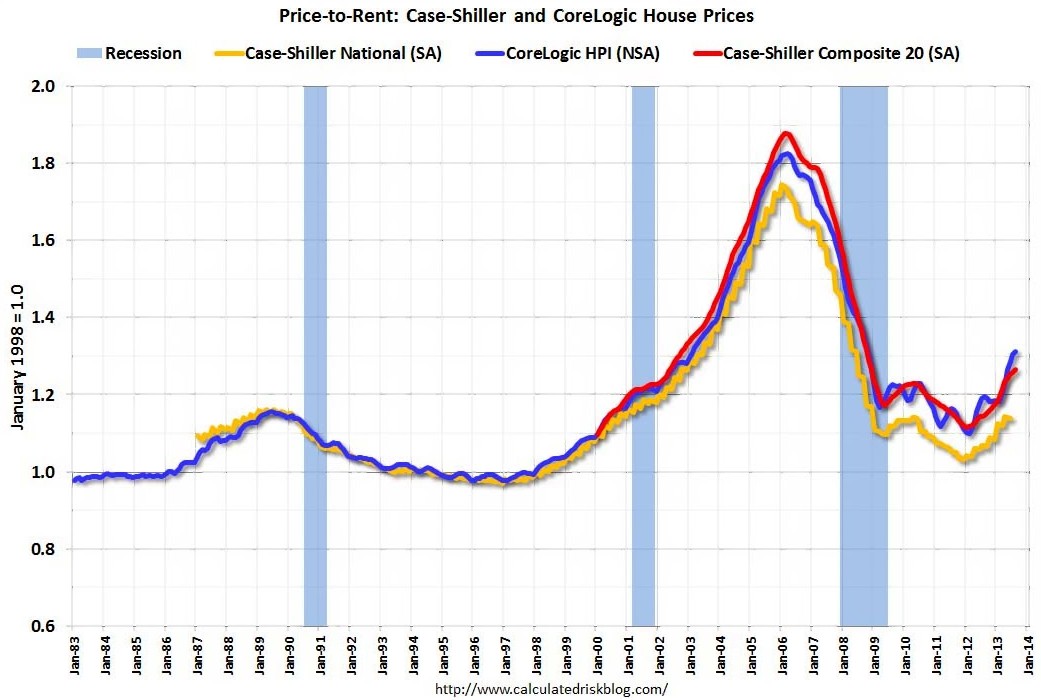
As are US house prices relative to rents:
Finally, the next chart shows the bubble peak, the post bubble minimum, and current nominal prices relative to January 2000 prices for all the Case-Shiller cities in nominal terms:
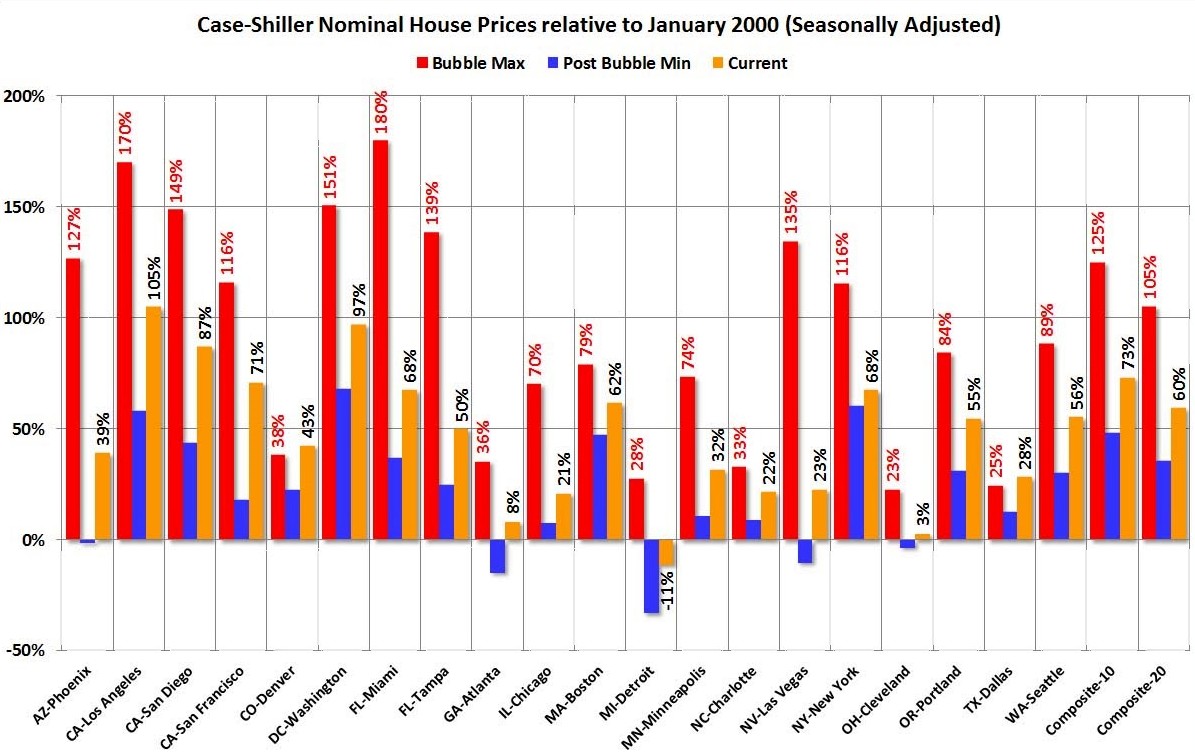
Not the huge volatility present across the supply-restricted markets (e.g. West Coast, Las Vegas, Arizona, Florida, North East), and the relative stability experienced elsewhere. Most markets, however, remain below their peak.
