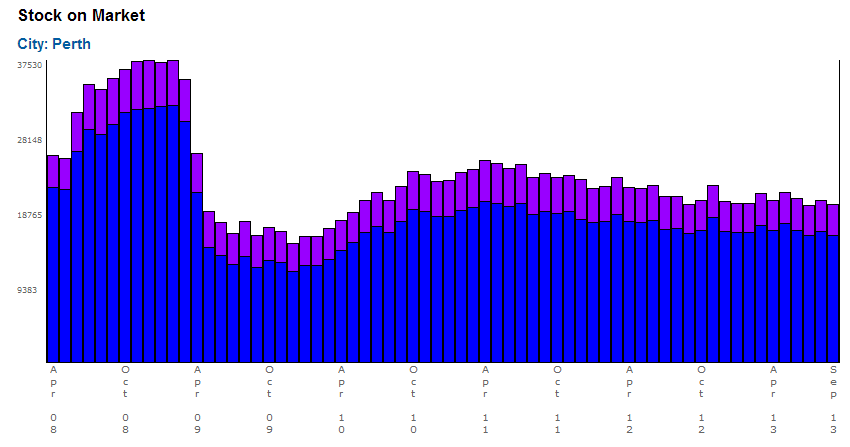
From SQM:
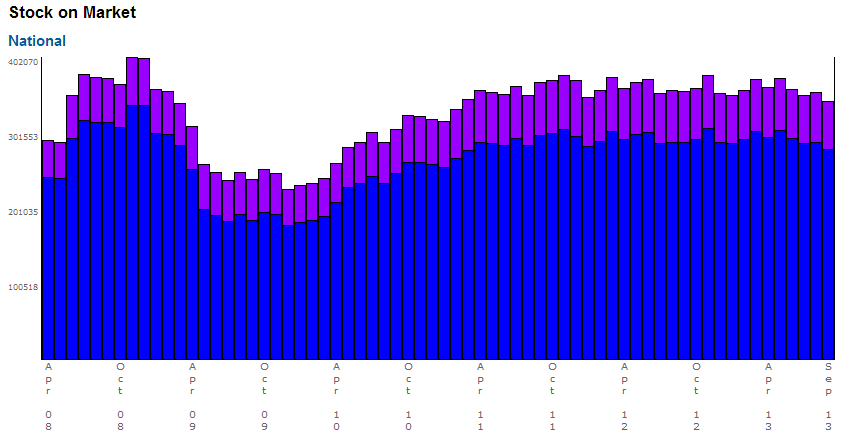
Figures released by SQM Research reveal that the level of residential property listings around the nation fell during the month of September, with national stock levels decreasing by -3.4% and coming to a total of 342,979.
Month on month, all capital cities recorded declines apart from Hobart, which increased ever so slightly, by 0.6%.
Year on year, the country also recorded a decline in stock, falling by –3.7% nationally, with every capital city recording yearly decreases, besides Darwin, which recorded quite a substantial yearly increase – 8.9%.
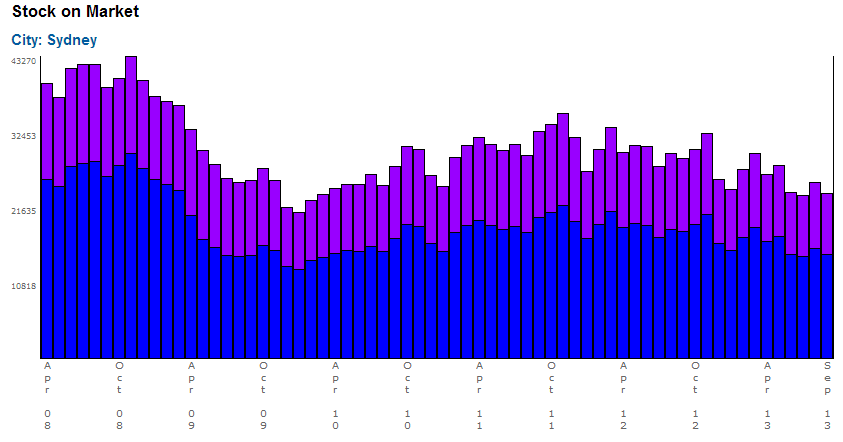
Sydney continues to take the lead in yearly declines with a staggering -17.6% decrease since September 2012 and as previously stated by SQM Research, we believe the housing market recovery will be led by this capital city, posed to witness 15-20% increases in house prices (as outlined in our most recent edition of Christopher’s Housing Boom and Bust Report 2013/2014).
SQM Research would however, like to point out that during the month of September, there were two weekends with events that would have affected the market place – the federal election on the 7th and the AFL Grand Final on the 28th of September. We note that during the federal election in 2010 (August) there was also a dip in stock levels, making it a likely contributor to a decline in stock during the spring selling season.
Managing Director of SQM Research, Louis Christopher says, “No doubt September’s supply was affected by the election. Normally listings rise for that month due to the start of spring selling campaigns. What this means is that the level of online residential sales listings will lift in October and November, due to seasonality but also in part due to vendors waiting for the election to be over.
Key Points
- Total online residential listings decreased during the month of September, recording a fall of -3.4% and coming to a total of 342,979.
- This figure represents a decrease of -3.7% when compared to the corresponding period of the previous year (September 2012).
- Hobart was the only capital city to record a monthly rise in listings, increasing by 0.6% during September and coming to a total of 4,278.
- Canberra recorded the most substantial monthly decline in stock levels, falling by -8.1% during September and coming to a total of 3,350.
- Darwin was the only capital city to record a yearly increase in stock levels, climbing 8.9% since the corresponding period of the previous year (September 2012) and coming to a total of 1,362.
- Sydney has once again recorded the most substantial yearly decrease in stock levels, falling by 17.6% since the corresponding period of the previous year (September 2012) and coming to a total of 23,576.