If there is one thing that differentiates the Australian housing market from most others, it’s the propensity for Australians to leverage into buy-to-let investment properties in the face of negative income returns, in the expectation that capital appreciation will repay debt and interest.
‘Negative gearing’, as it is known in Australia, is a popular form of leveraged investment in which an investor borrows money to buy an asset, but the income generated by that asset does not cover the interest on the loan. By definition, a negative gearing strategy can only make a profit if the asset rises in value by enough to cover the shortfall between the income received and the costs incurred from the asset. Alternatively, a negatively geared property may become neutrally or positively geared in a period of high rental increases.
Australia’s negative gearing rules are unusual in that they allow investors in both property and shares to write-off the cost of borrowing used to acquire an asset in addition to other holding costs against all sources of income (including labour income), not just the income generated by the asset. There are also no limitations on the income of the taxpayer, on the size of losses, or the period over which losses can be deducted.
By contrast, in most other countries, rental property expenses cannot be deducted against unrelated labour income, which effectively limits negative gearing to professional investors and developers.
In late April 2013, the ATO released its Taxation Statistics for the 2010-11 financial year (FY10). This report examines this data, which shows that Australia remains a nation of loss-making landlords that remain highly exposed to an economic downturn.
A nation of loss-making landlords:
The ability of investors to minimise tax via negative gearing, combined with easier access to credit and the halving of Capital Gains Tax (CGT) in 1999, has seen the popularity of property investment in Australia surge, as highlighted by the next chart:
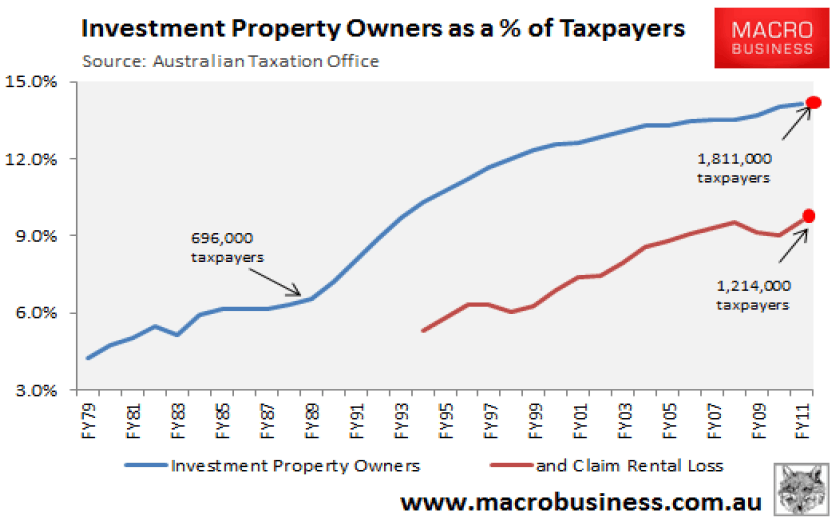
As you can see, Australia has morphed into a nation of landlords. In 1989-90, 696,000 taxpayers – 7.2% of the total – reported net rental income to the Australian Taxation Office (ATO). But in 2010-11, 1,811,000 did – 14.2% of total taxpayers.
One likely hypothesis for the large increase in property investment over the past 20 years is that the Baby Boomer generation – individuals born between 1946 and 1964 and comprising 25% of Australia’s population currently – began to reach peak earnings age (45 to 55 years-old) from the early 1990s and started investing heavily in property as a way of both minimising their tax and ‘saving’ for retirement.
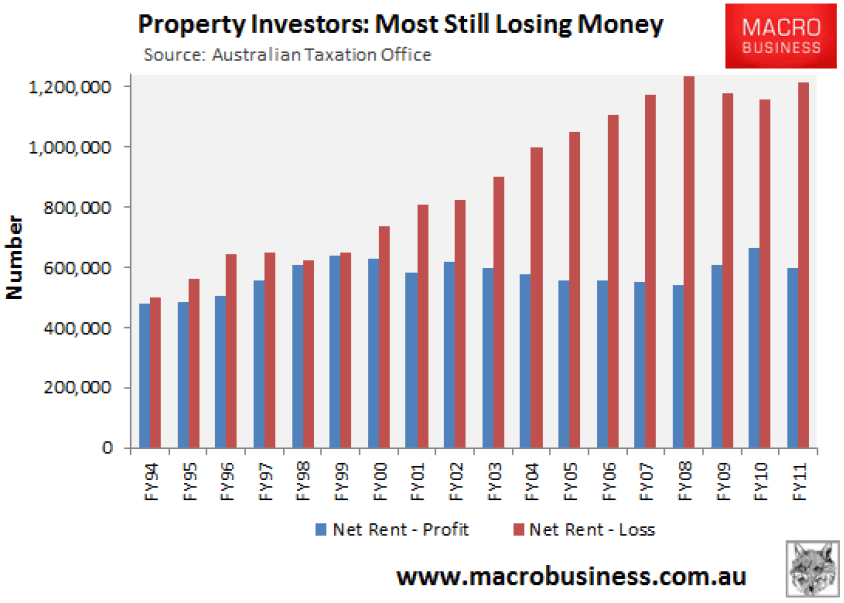
In 1998-99, the number of investors claiming net rental profits (i.e. ‘positively geared’) was roughly equal to those claiming net rental losses (i.e. ‘negatively geared’). Since then, however, the situation has changed markedly, with the latest ATO data showing that there were just over 1.2 million negatively geared property investors in Australia in 2010-11, representing two-thirds of all property investment.
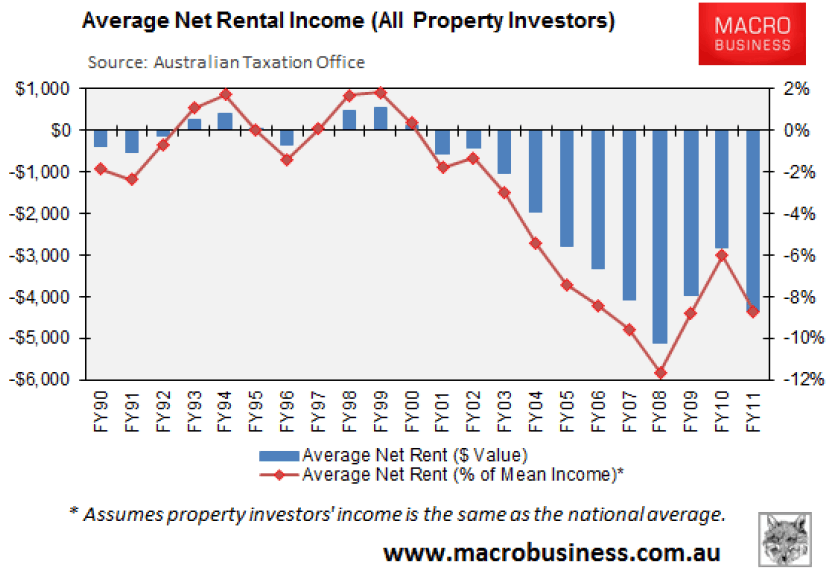
Up until 2000, property investment was more or less neutral from an income perspective, with aggregate rental receipts covering costs. From 2000 onwards, however, net rents deteriorated sharply; with aggregate losses totalling $7.9 billion in 2010-11 (see next chart).
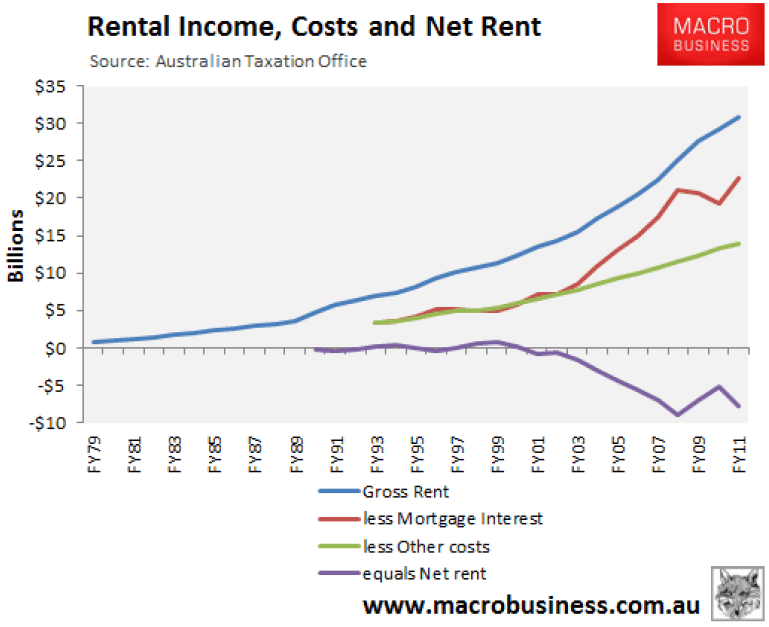
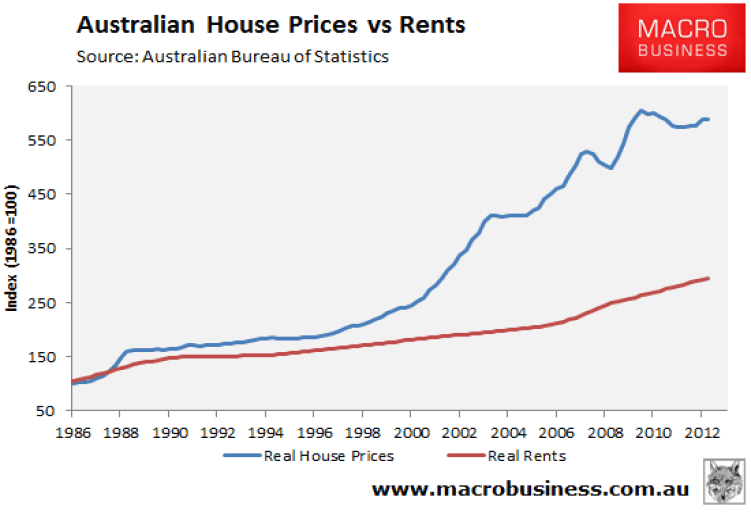
The worsening rental returns since 2000 are primarily accounted for by the strong appreciation of house prices relative to weaker rental growth (see next chart).
The logical explanation for the decline in net rental returns from 2000 and the surge of negatively geared property investment was the Australian Government’s decision in 1999 to change the nation’s capital gains tax (CGT) rules by halving the rate of tax payable on capital gains earned on assets held for more than 12 months. This change, in combination with the negative gearing provisions allowing investors to offset rental losses against other (labour) income, encouraged investors to speculate on rising housing values in full knowledge that any losses would reduce their overall tax liability, and any capital gains would be taxed at only half the rate of labour income.
The net result of these policies is that Australian investors have increasingly become Ponzi borrowers – Hyman Minsky’s term for borrowers who rely heavily on capital gains to repay debt and interest – in the belief that housing is a sure fire investment.
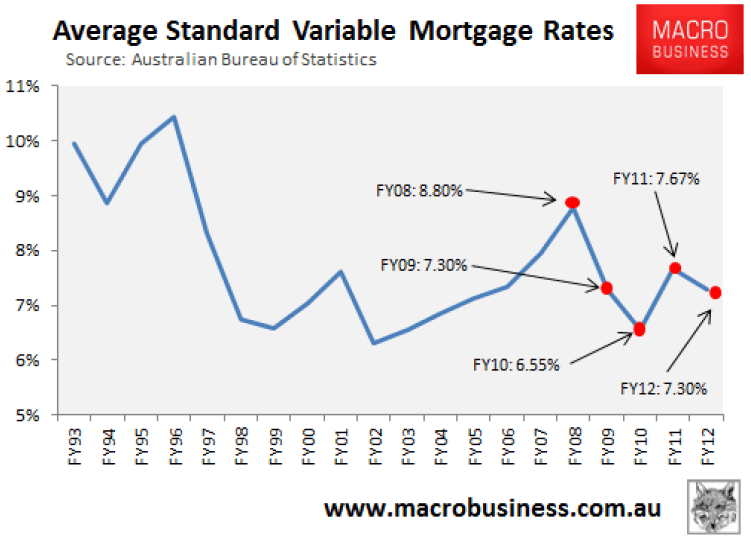
That said, aggregate rental losses in 2011-12 were lower than the 2007-08 peak when property investors claimed a record $9.1 billion of losses. The fall in losses over this period was due in part to a reduction in mortgage rates – from an average of 8.8% in 2007-08 to 7.7% in 2010-11 – which reduced the amount of mortgage interest payable.
As shown by the next chart, average mortgage rates decreased to 7.3% over 2011-12, suggesting that next year’s release of the ATO Taxation Statistics (covering FY12) will likely reveal a reduction in aggregate rental losses.
Rental losses comprise a significant proportion of income:
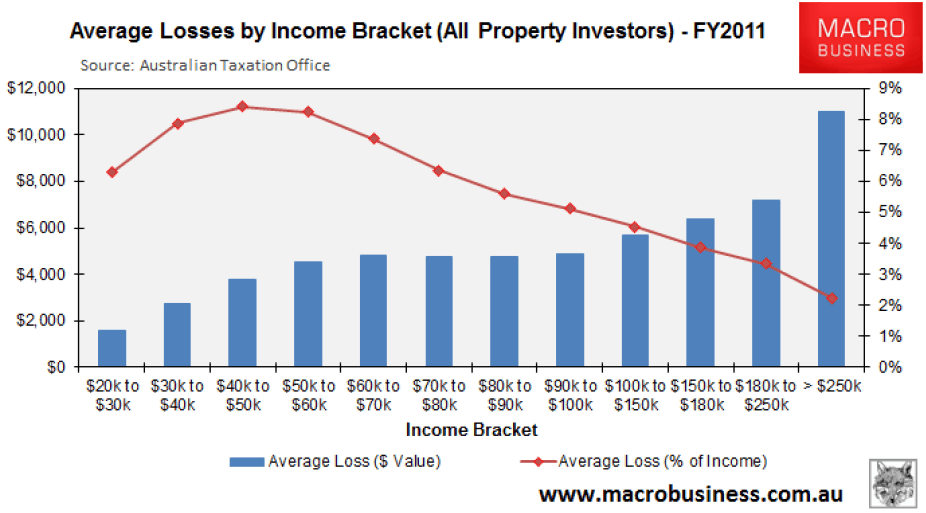
To put the overall level of income losses into perspective, rental losses across all investment properties nationally averaged $4,340 per investor in 2010-11, or 8.7% of average taxable income (see next chart).
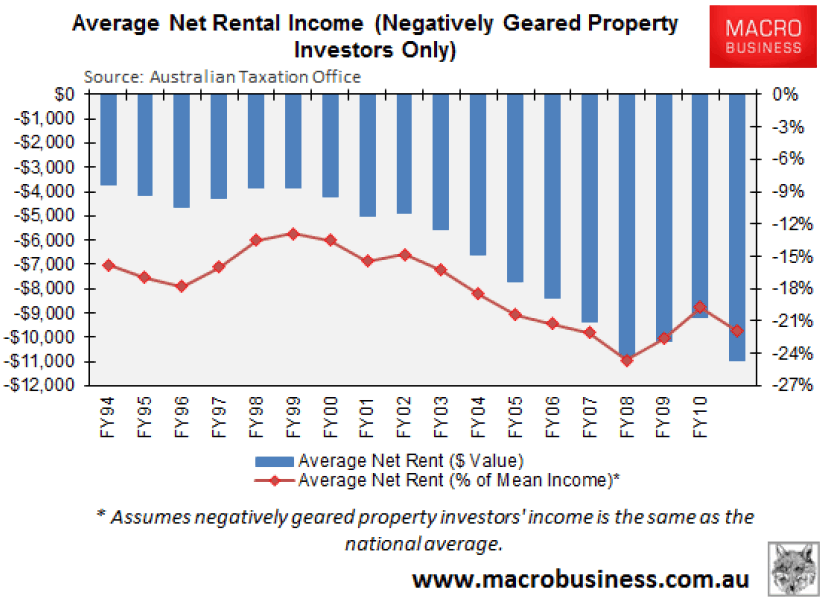
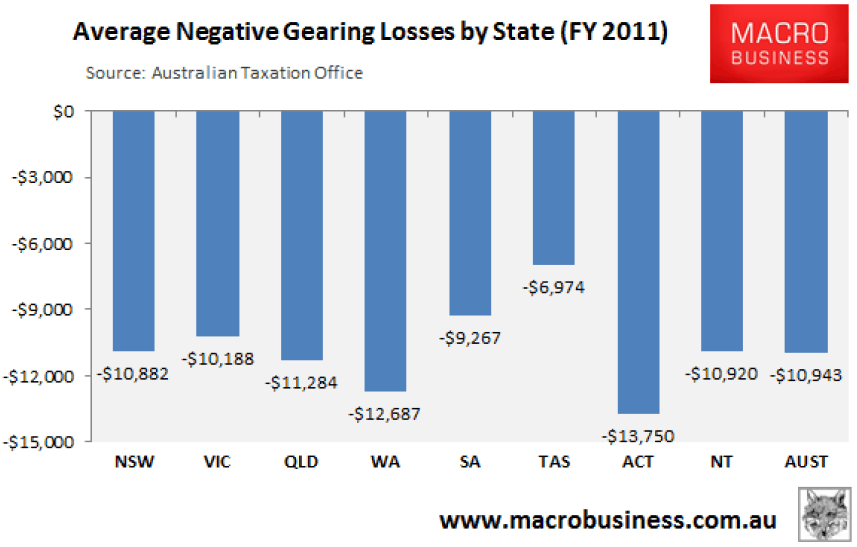
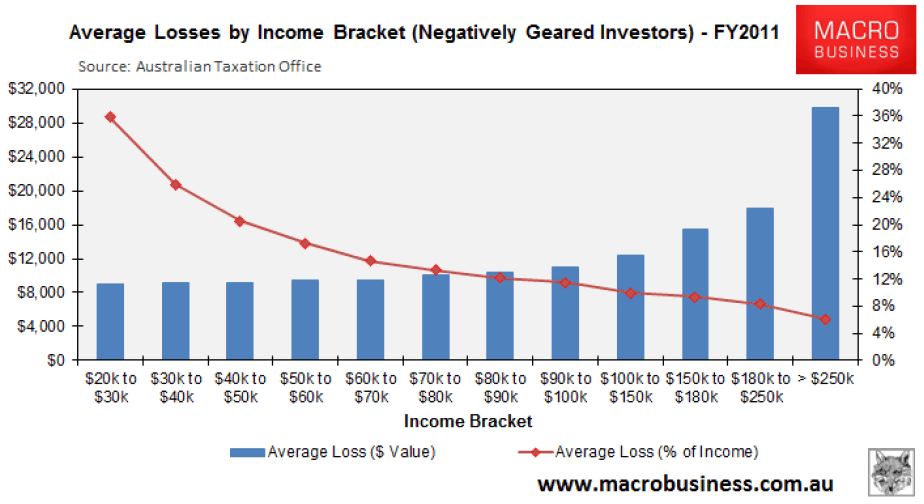
However, losses for negatively geared investors were much higher, totalling $10,943 per investor in 2010-11, or 22% of average taxable income (see next chart).
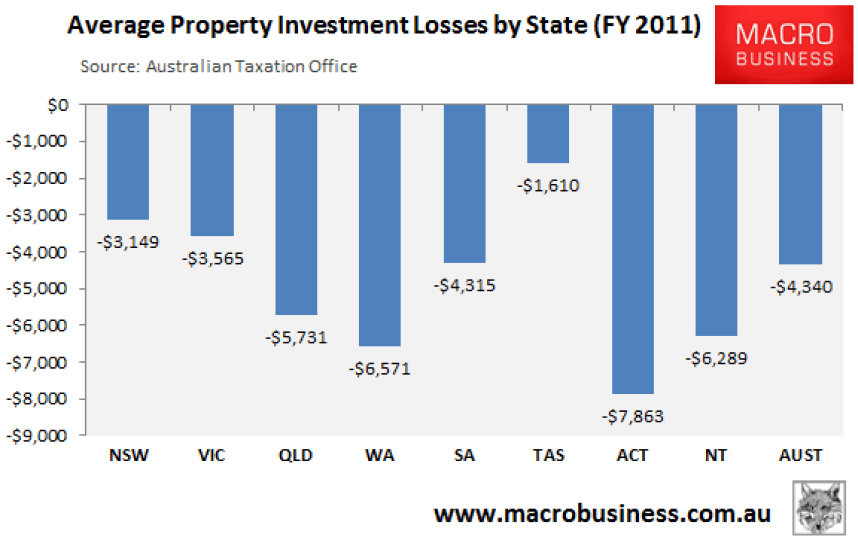
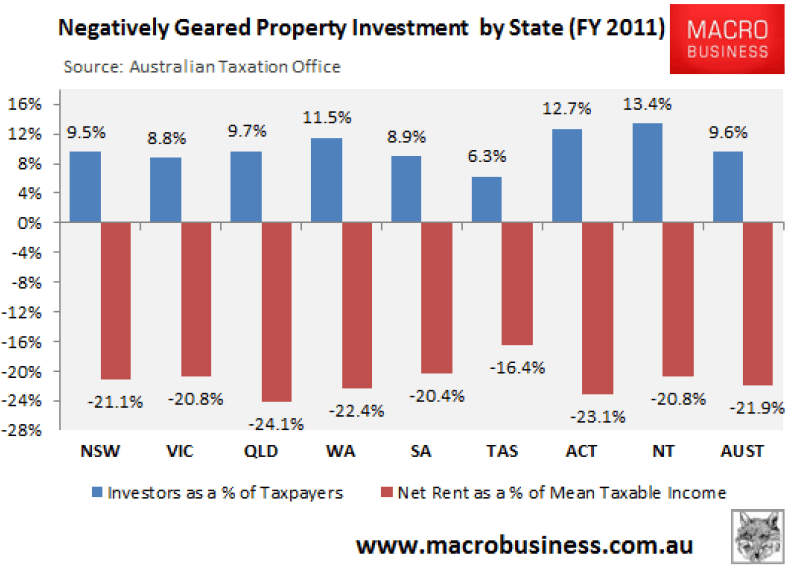
At the state level, property investment is most pervasive in the Northern Territory and the ACT, whereas actual income losses are highest in the ACT and Queensland.
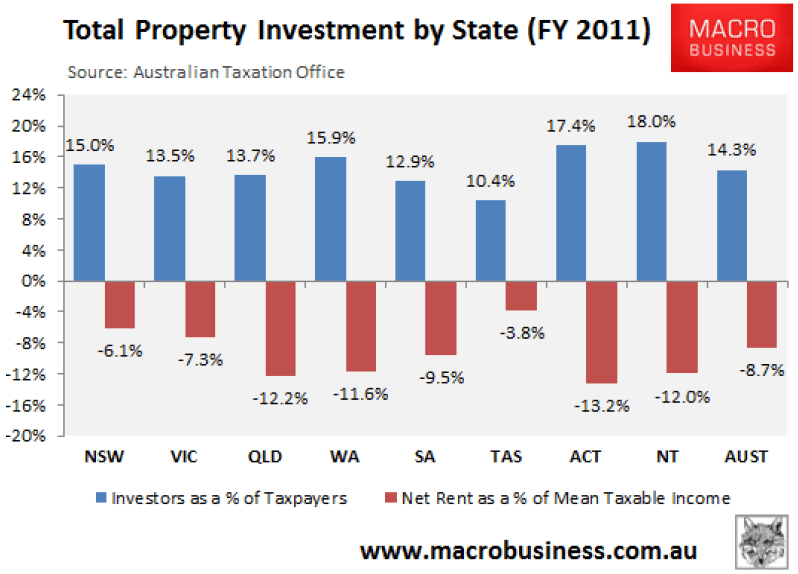
By comparison, actual average dollar losses per property investor in 2010-11 were highest in the ACT ($7,863) and Western Australia ($6,571), and lowest in Tasmania ($1,610) and New South Wales ($3,149).
In a similar vein, negatively geared property investment is most pervasive in the Northern Territory and the ACT, whereas actual income losses are highest in Queensland and the ACT.
By comparison, actual average dollar losses per negatively geared property investor in 2010 11 were highest in the ACT ($13,750) and Western Australia ($12,687), and lowest in Tasmania ($6,974) and South Australia ($9,267).
Losses are concentrated in lower income groups:
According to the ATO Statistics, property investment is most popular amongst higher income earners, presumably due to the increased tax benefits on offer as one moves up the marginal tax scale.
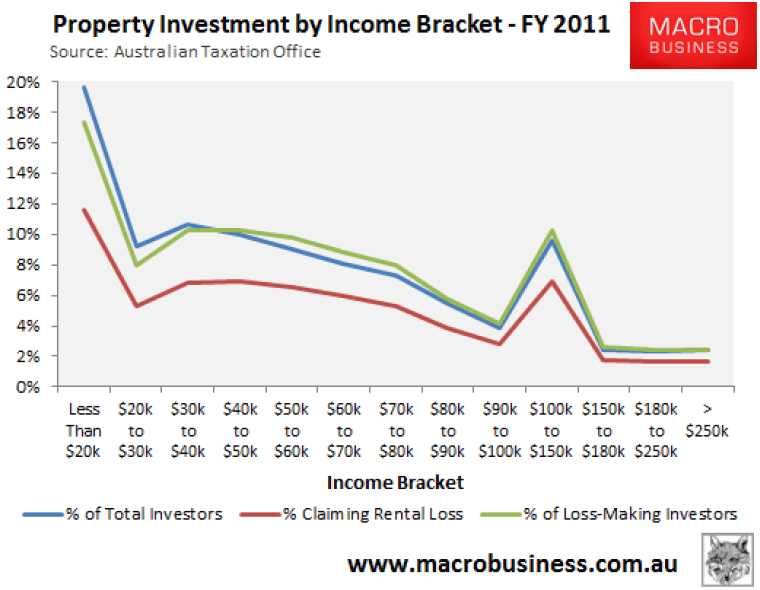
In 2010-11, one in three taxpayers earning over $180,000 held an investment property, with nearly one in four negatively geared. By comparison, 15% of taxpayers earning between $50,000 and $60,000 held an investment property in 2011-12, with 11% negatively geared (see next chart).
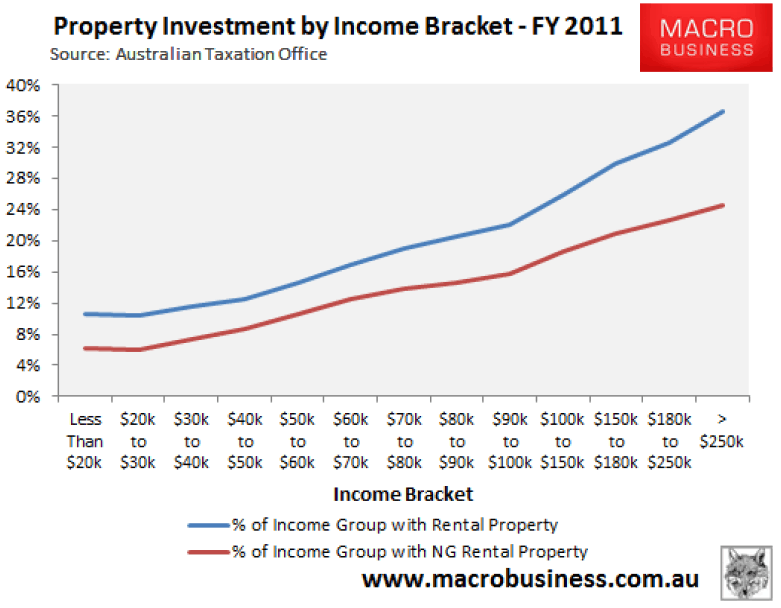
However, while property investment is more prevalent amongst higher income earners, the bulk of rental properties are held by middle-to-lower income earners, with 74% of all property investors (72% of negatively geared investors) earning less than $80,000 per annum in 2010-11.
As illustrated by the next chart, the share of property investors residing at each income bracket fell as income levels rose in 2010-11:
The average reported losses on investment properties are also a significant percentage of taxable income. In 2010-11, average net rental losses typically comprised between 4% to 8% of income, with relative losses higher at lower tax brackets. This is despite higher income earners suffering significantly higher dollar losses:
For negatively geared investors only, average net rental losses were much higher in 2010-11, typically representing between 10% to 25% of taxable income. Again, percentage losses were heavily skewed towards the lower income brackets, with higher income brackets incurring higher dollar losses.
A rush for the exits?
Apologists for Australia’s stretched housing valuations often claim that Australia’s housing debt is safe because it is held primarily by upper-income earners. However, this claim is challenged by the ATO Statistics, which shows that negatively geared property investment in Australia is primarily a middle class affair.
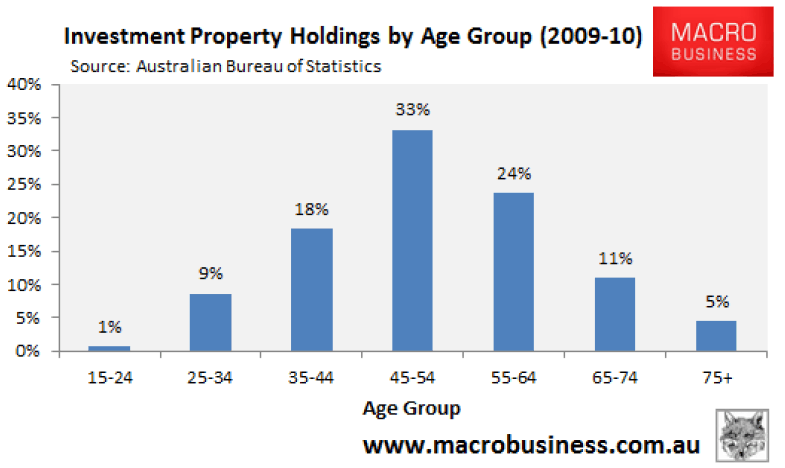
To make matters worse, the 2009-10 Australian Bureau of Statistics (ABS) Household Wealth and Wealth Distribution survey showed that nearly three quarters of Australia’s investment properties were held by individuals aged 45 and over (see next chart).
The concentration of negatively geared properties in lower income and older age cohorts is important for two reasons.
First, negative gearing is only attractive as a tax minimization strategy when there is labour income to offset rental losses against. However, once one enters retirement and ceases working, they lose the ability to offset tax and negatively geared property investment loses its attractiveness.
Second, retirees are more likely to be net sellers of property (as well as financial assets) in order to fund their lifestyles. And the incentive to unwind property holdings will likely be greatest amongst the lower-to-middle income earners that hold the bulk of Australia’s negatively geared investment properties.
With the oldest Baby Boomers having turned 65 in 2011, the shift into retirement has already officially begun and will gain strength throughout the decade as more and more Baby Boomers exit the workforce.
Pressure to sell could also intensify in the event that the mining boom unwinds in a disorderly manner, causing unemployment to rise and precluding investors’ from being able to meet their mortgage repayments.
