

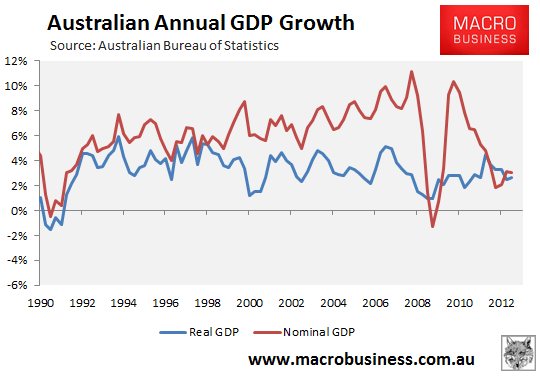
The Australian Bureau of Statistics (ABS) today released the national accounts for the June quarter, which registered a 0.6% increase in real GDP over the quarter and a 2.6% rise over the year. The result met market expectations.
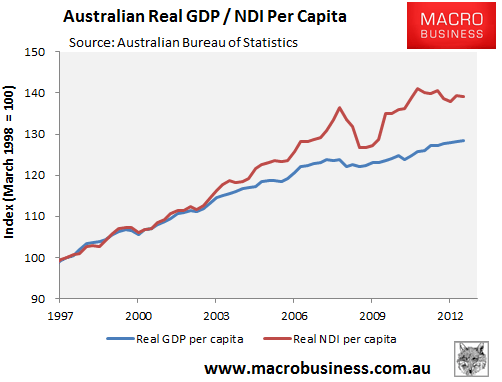
On a per capita basis, however, real GDP increased by only 0.1% and by 0.9% over the year. Further, real national disposable income per capital fell by 0.1% over the quarter and by 0.9% over the year.
The below ABS table shows the breakdown by the main components compared to the previous quarter:
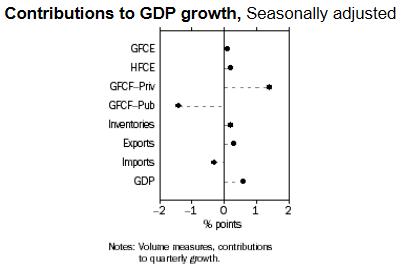
According to the ABS, growth for the quarter was driven by a 0.4% contribution from final consumption expenditure, a 1.4% contribution from Private gross fixed capital formation, and a 0.2% contribution from inventories. These increases were partially offset by a 1.4% fall in Public gross fixed capital formation.
The industries that drove growth in the June quarter were Financial and insurance services (up 2.1%) and Construction (up 1.9%). Financial and insurance services contributed 0.2 percentage points to the increase in GDP while Construction contributed 0.1 percentage points.
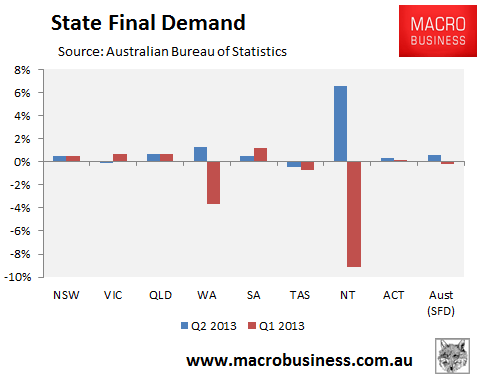
Results were mixed at the state level, with final demand growing in NSW (+0.5%), QLD (+0.6%), Western Australia (+1.3%), South Australia (+0.5%), the NT (+6.5%), and the ACT (+0.3%), but falling in Tasmania (-0.5%) and flat in Victoria (0.0%) (Note: state final demand is different to GDP).
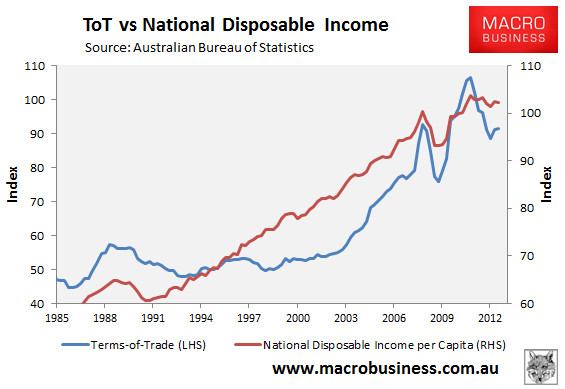
The terms-of-trade rose for the second consecutive quarter, up by 0.2% on higher commodity (iron ore) prices:
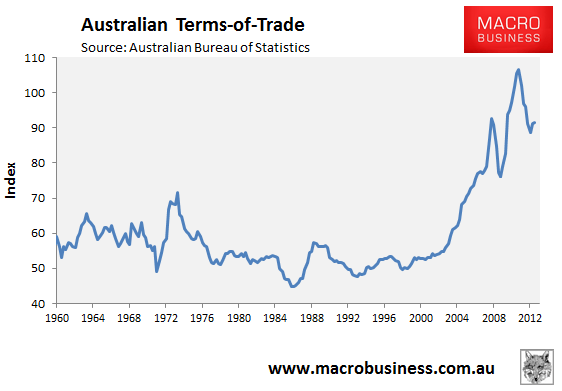
However, the sligh rise in the terms-of-trade was not enough to arrest falling income growth, with real per capital national disposable income (NDI) sliding by 0.1% over the quarter and by 0.9% over the year. Going forward, income growth will continue to be weak as long as the terms-of-trade unwinds from its current very high level (see below charts).
The slight increase in the terms-of-trade, combined with the falling Dollar, also helped nominal GDP to remain above real GDP, which is a positive for government finances:
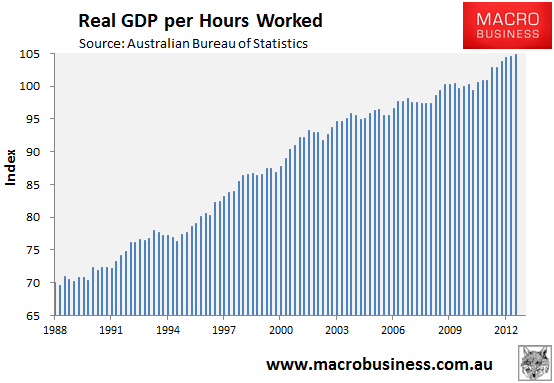
One of the best stories to come out of recent releases is that productivity has improved. Real GDP per hour worked rose by 0.3% over the June quarter and was up 1.8% over the year. It looks like the structural adjustment under way continues to create greater efficiencies in the weaker sectors:
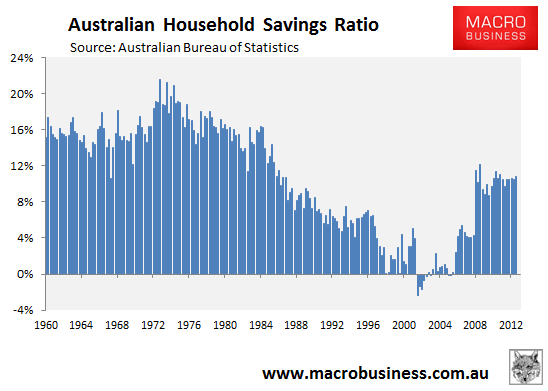
Finally, the household savings ratio rose over the quarter to 10.8% from 10.5%, and remains well above the levels of the 2000s housing/credit boom, but below the recent peak level of 12.1% reached in June 2009 in the wake of the financial crisis. Households have clearly returned to long-run norms in regards to their savings behaviour (see next chart).
Overall, it’s a reasonable result in the context of sub-trend growth. On the one hand, headline GDP met expectations and productivity continues to improve. On the other, per capita real GDP growth remains weak – barely keeping-up with Australia’s growing population – and per capita national disposable income continues to trend lower.
Looking ahead, GDP growth is likely to weaken significantly as mining capex unwinds, whereas income growth will also face stiff headwinds to the extend that commodity prices and the terms-of-trade drift lower.
