Australia’s four main housing data providers – the Australian Bureau of Statistics (ABS), Australian Property Monitors (APM), RP Data-Rismark, and Residex – have provided their capital city house price indices results for the June quarter of 2013.
The ABS, APM and Residex reported that national capital city house prices rose by 2.4%, 2.8% and 2.1% respectively over the quarter, whereas RP Data-Rismark recorded house price growth of only 0.1% over the same period, although it did record strong subsequent growth in July.
Looking at unit prices at the national capital city level, again APM and Residex reported growth of 2.0% and 1.9% respectively, whereas RP Data-Rismark recorded growth of only 0.5%, again with solid growth recorded subsequently in July.
The variations between the reported results largely reflect differences in how the various indices are constructed, as well as volatility inherent in all short-term economic data.
In a nutshell, both the ABS and APM use variants of the stratified median price method, which controls for changes in the composition of properties sold by separating the total sample of properties into a number of geographical sub-samples, and then into different strata based on the long-term average price level of properties in those regions. APM separately measures both capital city house and unit prices, whereas the
ABS measures detached house prices only. As the ABS and APM methodologies are closely aligned, they often mirror each other’s house price movements.
RP Data-Rismark publishes a hedonic index, which measures price changes for both detached houses and units on a like-for-like basis according to their key attributes, such as location, land size, number of bedrooms and bathrooms, and so on. In March 2012, RP Data-Rismark moved from a monthly index to reporting price changes on a daily non-seasonally adjusted basis, which has led to significant volatility in their results, as well as a question mark over whether it lags the other less frequent indices (see here).
Finally, Residex uses a repeat sales methodology, similar to the Case-Shiller Index in the United States, which calculates price changes based upon repeat sales of the same homes. In order to minimise the pricedistorting effects that renovations have on home prices, Residex also employs a combination of the hedonic technology and stratified median index technologies used by the other providers.
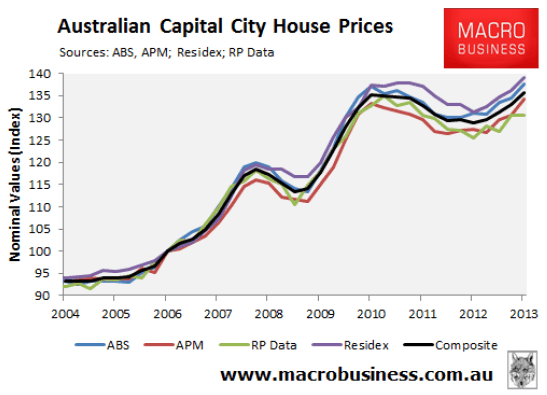
Although each house price indices uses a different methodology, they do tend to track each other over time, as shown by the next chart, which plots capital city house prices at the national level since 2003. Note, a composite index has also been included, which is the average of the four data provider’s indices.
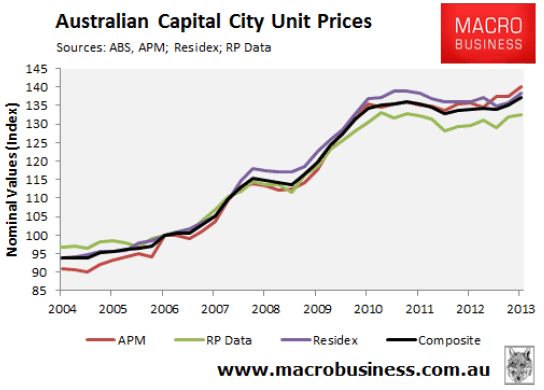
The various unit price indices tend to display more variation than for houses, although they do still tend to track each other when viewed over longer time periods (see next chart).
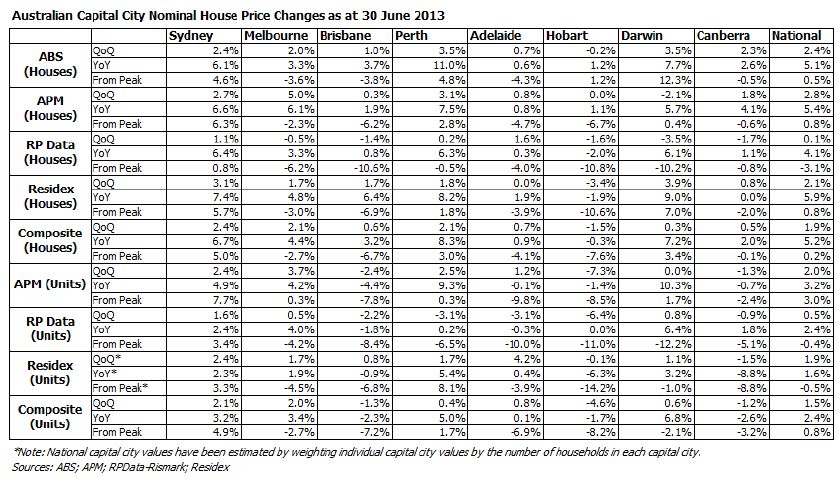
The next chart shows the quarterly and annual house price changes at the national capital city level. Data on price changes for individual capital cities are provided in the table at the end of this report.
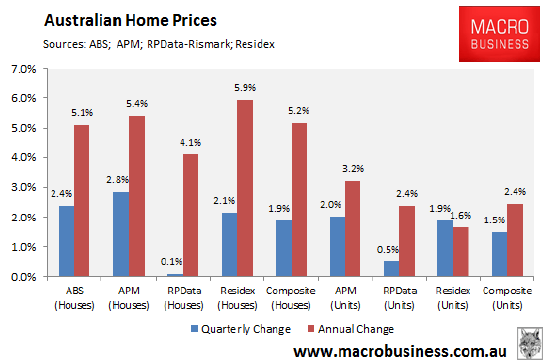
While the results differ somewhat, it is clear that house prices have generally performed better than unit prices, experiencing double the rate of price growth over the past year.
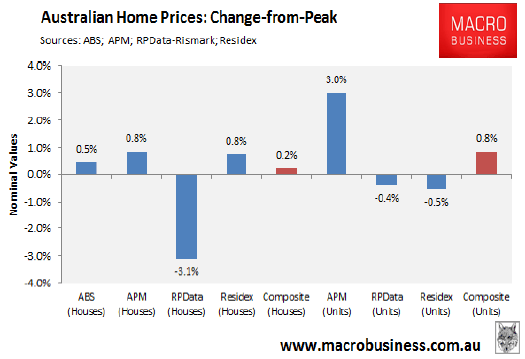
It is a different story when assessing the change in values since home prices peaked in mid-to-late 2010. While capital city house values were up 0.2% in June on a composite basis, unit values were 0.8% higher (see next chart).
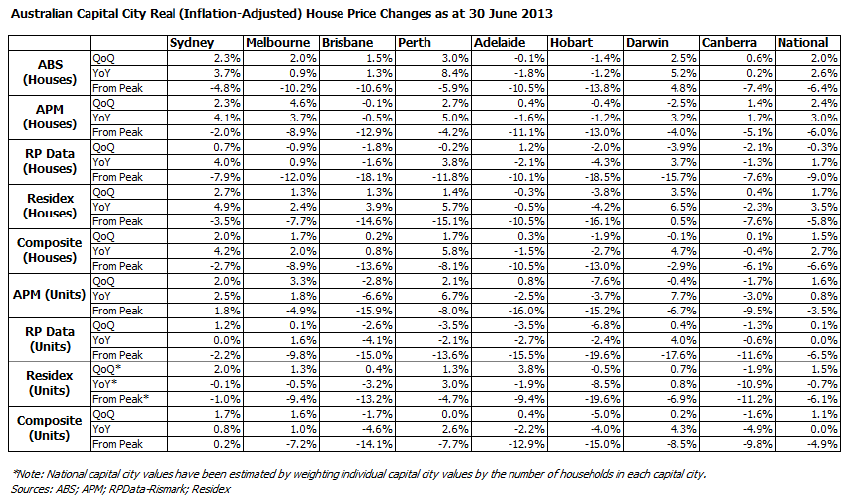
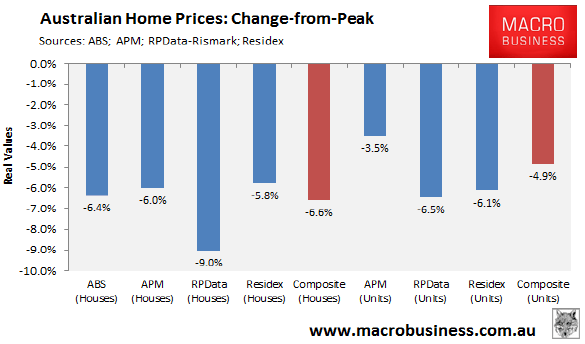
When adjusted for inflation, (real) prices for both detached houses and units are at late-2009 levels (see below charts).
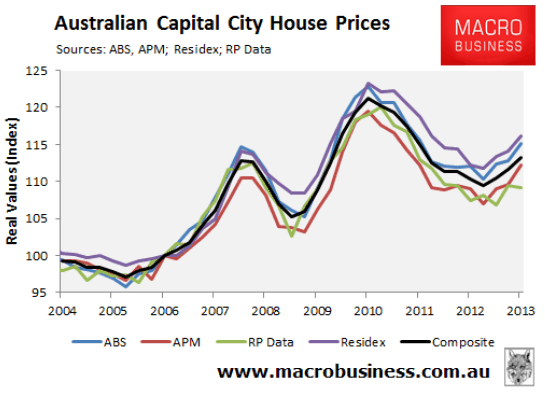
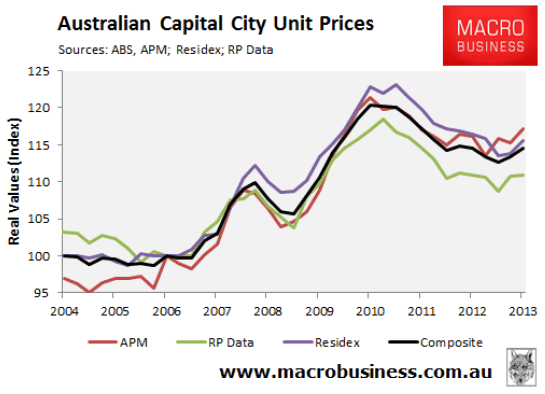
Meanwhile, as shown in the next chart, real house values are nearly 7% below their mid-2010 peak, whereas real unit values are nearly 5% below peak.
The question now is whether Australian home prices will continue to recover. While all real estate is local – specific capital reports will be released in the future (following last month’s Perth housing report) – there are general macroeconomic factors at play that are likely to influence the direction of home prices nationally into the future.
Short-term outlook good:
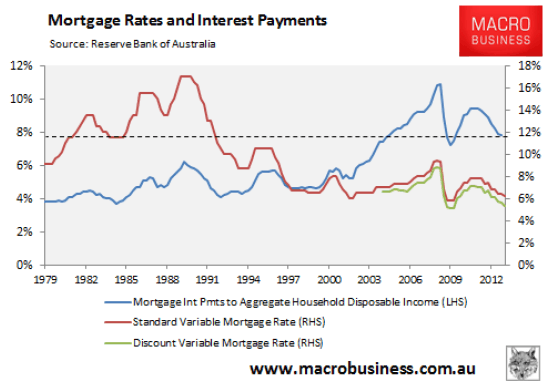
In the short-term, prices are likely to be pushed higher by the Reserve Bank’s 2.25% of cuts to official interest rates since November 2011. These cuts have caused nominal variable mortgage rates to fall to their lowest level since the early-1960s. In turn, the share of aggregate (economy-wide) household disposable income eaten-up by mortgage interest payments has declined significantly, although it remains high by historical standards (see next chart).
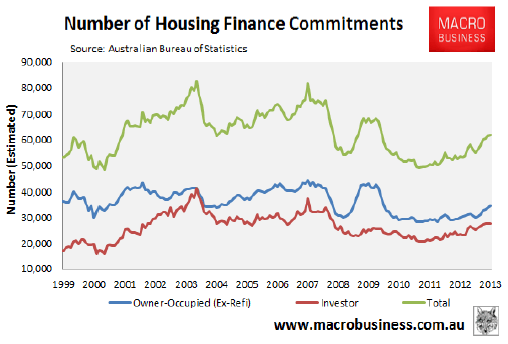
The slashing of mortgage rates has begun to have a material impact of mortgage demand, with housing finance commitments rising strongly, particularly over the past six months (see next chart).
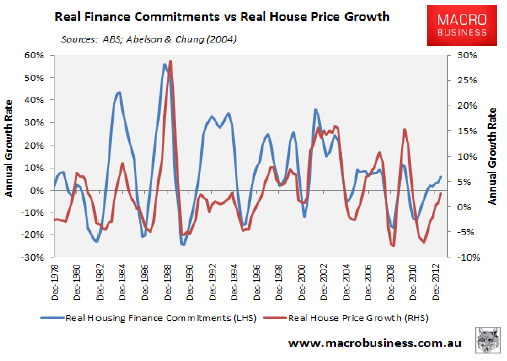
You can see from the next chart that there is a strong correlation between the growth of housing finance commitments and house prices, suggesting that prices nationally will continue to increase over the remainder of the year and possible into 2014.
However, while mortgage demand has accelerated, it has become increasingly unbalanced, with demand from first home buyers (FHBs) weakening significantly due in part to cuts to grants on pre-existing dwellings in New South Wales and Queensland in October 2012. Victoria and Tasmania also cut grants from July 2013, whereas the ACT and Western Australia are set to follow from September, which should show up in the housing finance statistics throughout the remainder of the year.
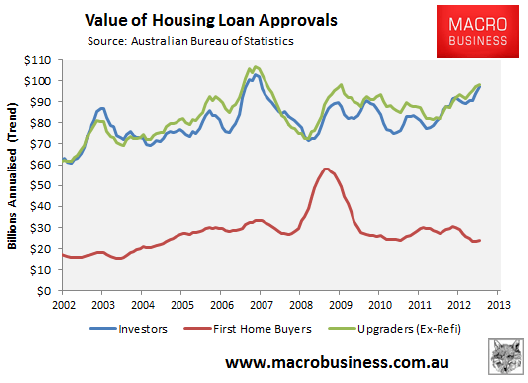
As shown above, the void in FHB demand has so far been filled by investors and upgraders. Although given FHBs are such a key source of new mortgage demand, one wonders how far this process can run, particularly upgraders buying and selling to each other.
But structural headwinds remain:
Looking further ahead, the Australian housing market continues to face structural headwinds.
As noted previously on MacroBusiness, the huge surge in commodity prices from 2003 significantly boosted household incomes, enabling home prices to remain stronger for longer. According to research from the Australian Treasury, around half the growth in average incomes over the 2000s was caused by the rise in the terms-of-trade via higher commodity prices. This compares to previous decades, when the terms-of-trade made no significant contribution to average incomes growth (see next chart).
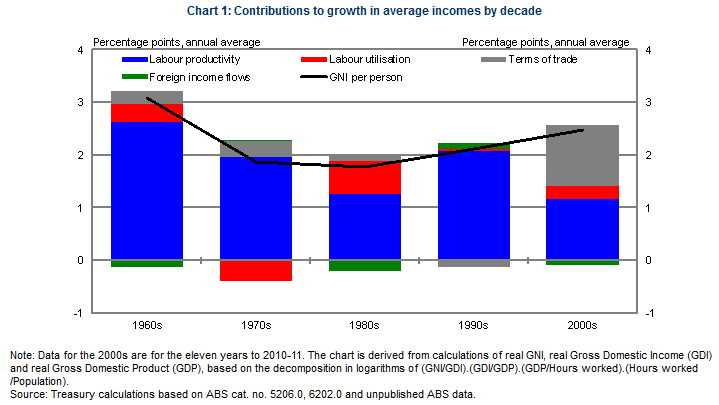
The below chart, which plots the annual growth rates in per capita household incomes and the average growth rates for each decade, illustrates the situation more clearly:
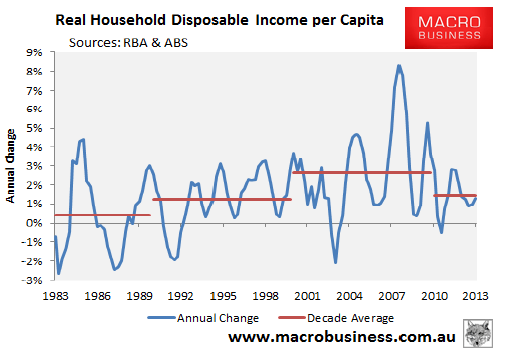
As you can see, the terms-of-trade induced surge in household incomes over the 2000s was remarkable, with real per capita income growth averaging an extraordinary 2.6% over the decade, well above the 0.4% average growth rate experienced over the 1980s or the 1.25% average growth rate experienced over the 1990s. Between 2010 and 2013, real per capita household income growth has averaged just 1.4%, despite the terms-of-trade index as at March 2013 still sitting above its level at the beginning of this decade.
It is reasonable to assume that income growth will be much slower going forward. Indeed, to the extent that commodity prices and the terms-of-trade continue to retrace back towards their longer-term average levels, it will detract from household income growth, unwinding much of the gains enjoyed over the 2000s, and reducing the scope for asset price increases.
The employment market also represents a headwind for the housing market.
The latest available data suggests that the mining investment boom has already peaked and is trending down as mining projects move from the construction phase to the operational (export) phase (see next chart).
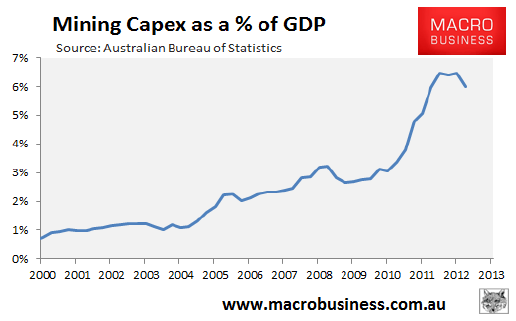
According to recent RBA estimates, the mining sector accounts for nearly 10% of Australian employment. Most of these jobs are in areas directly related to mining capital expenditures (capex), such as construction workers, engineers, and other mining services. As mining projects finish, so will these many of these jobs, which is likely to lead to a material increase in the unemployment rate unless other areas of the economy can expand sufficiently to fill the void (unlikely in our view).
Adding to these pressures, the downturn in employment caused by the unwinding of the mining boom will be met by a longer-term decline in the working aged population as the baby boomer generation retires, resulting in a falling share of workers in the economy.
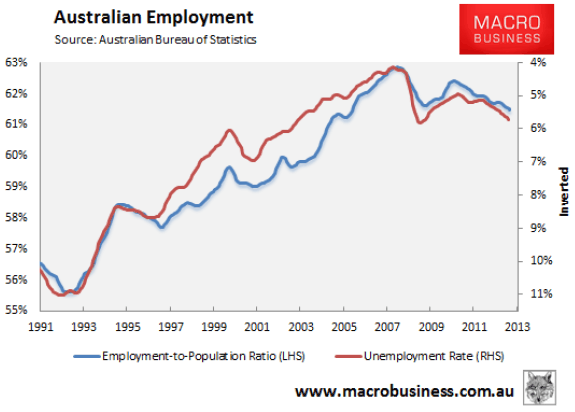
Already, these two factors – higher unemployment and a falling employment-to-population ratio – are beginning to manifest in the official labour force statistics, with both measures trending down since late-2010 (see next chart).
Until recently, increasing commodity prices (terms-of-trade), booming mining-related capex, and the rising employment-to-population ratio provided strong support for the economy and the housing market. However, the situation is now reversing, with the ageing of the population likely to combine with falling terms-of-trade and mining investment to create stiff headwinds into the future.
Bottom Line:
While the lowering of mortgage rates is likely to win out in the short-term, with house prices likely to continue rising over the coming year, the market risks running out of steam and entering a period of decline once mortgage rates bottom-out and the above structural headwinds take over. Indeed, with Australian households carrying very high debt loads, there is also the risk of a price reversal in the event that mortgage rates were to normalise, although we don’t think the Reserve Bank is likely to change track on interest rates any time soon.