
Yesterday I spent quite a few hours crunching APRA’s horribly presented bank deposit time series data. Regular readers will know that we’ve witnessed falling deposit growth rates for the past twelve months as the RBA’s campaign of financial repression has squashed interest rate spreads. I’ve created some new charts splitting out households and corporate savings to gauge the trends.
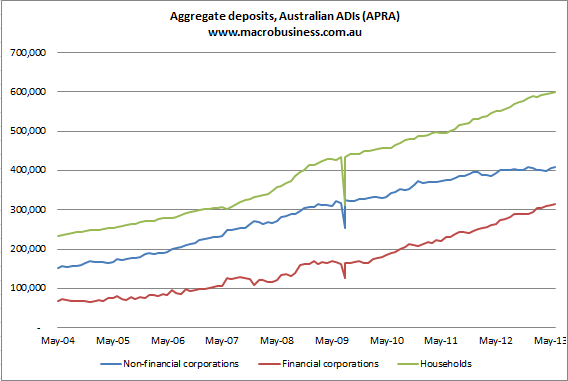
First, here’s the chart of Australian aggregate bank deposit growth by segment:
And the same segments split by year-on-year growth rates:
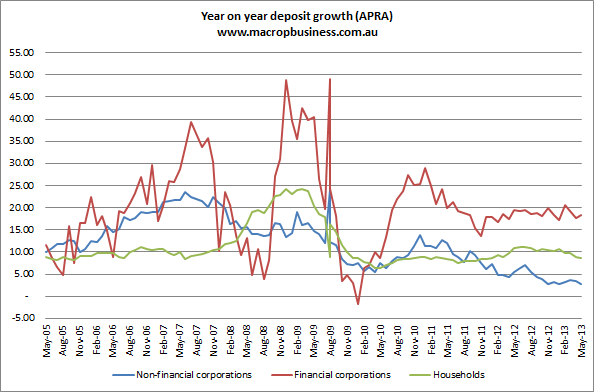
There a number of points to make. I am not an expert on the deposit flows of financial corporations. The big GFC spike and then collapse, followed by high and ongoing flows could be associated with dollar-related flows but I’m just guessing.
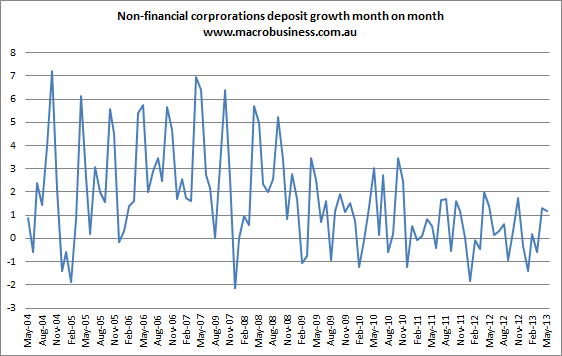
Non-financial corporations (blue) are also a little mysterious. My guess is that flows rose pre-GFC as Australian business leveraged up on cheap debt then kept retained earnings in the bank for a carry spread. Ever since, as borrowing costs remained higher and deposit rates have steadily fallen, that has reversed with corporations opting for use of less debt and more equity for limited growth options and capital management strategies. Deposit growth for the segment is now approaching zero. Here is the month-on-month growth chart:
For households (green), the 8% or so growth rates of 2005, when national savings were at their nadir, rose steadily into 2006. The big pre-GFC spike in savings commenced late 2007 in conjunction with the freezing of certain US credit markets.
Since the GFC spike, growth rates have not been as elevated as one might expect given the degree of obvious consumer caution on the expenditure side of the economy. This is perhaps not as surprising as it appears given the very different economy of the period.
We know that loans create deposits, not the other way around. Given the very subdued credit growth of the post-GFC period we might expect slow deposit growth. Add in troubled household income growth for the period and it starts to become a wonder that households have managed to keep up deposit growth at all. To my mind it’s pretty obvious that the deposit growth rate has been held up at the price of lower expenditure growth in the economy, hence the suffering of retail.
But as you’ve no doubt noticed, the trend in household deposit growth has been declining since the current round of rate cuts began in late 2011. Here is the month-on-month growth chart:
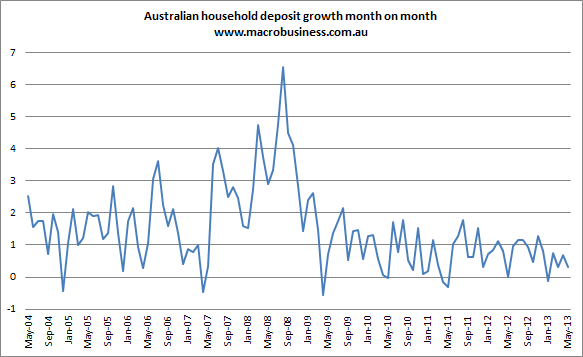
There are likely to be a number of reasons for this. The declines in the terms of trade and national income are probably playing a role. Credit growth is much lower now as well. And remember, all through the pre-GFC period the banks were pouring more and more money into lending from offshore borrowing. That growth has stopped.
For the past six months, in fact, household deposit growth has almost halved from last year, down below 5% from last year’s 8-9% average. It is now running well below the supposedly profligate period of national dis-saving of 2004/5. To explain this, it’s hard to look past the shift into more risky assets as the primary driver. Financial repression is pushing more savings out on the risk curve..
There a few rough conclusions to draw. The first is that household’s preferred post-GFC mix of assets is swinging from deposits to leveraged assets. Ironically, this may bode poorly for retail if households continue to try to compensate for this higher risk investment by spending less.
Second, the recent slow turnaround in credit growth does not have much headroom to grow before it runs into the glass ceiling of the banks needing to boost their offshore borrowing so that deposits as well can grow.
This, in turn, has implications for the attempted rebalancing of Australian growth from the export-centric mining sector to private domestic demand. It seems unlikely that the banks will be able to grow credit issuance for very long before they’ll also need to begin funding a wider current account deficit.
In short, assuming the rebalancing proceeds smoothly (which I doubt), the RBA, APRA and the people of Australia face a trade-off between financial stability and growth.
Update.
Banking Day points out today that:
When asked what was the most enjoyable way to “spend” money, 26 per cent of respondents to ING Direct’s Financial Wellbeing Index nominated “saving for a particular goal” and 17 per cent nominated “paying debt”.
Twenty-nine per cent said they were “uncomfortable” with the level of their personal savings, meaning that they would like to increase their savings.
ING Direct also found that the average number of credit cards per household has dropped from 1.8 to 1.7.
Dun & Bradstreet found that consumers saw lower interest rates as a way of meeting their debt repayments more easily and of reducing their debts.
Hope remains while households remain true.
