From Professor Rodney Maddock of the Funding Australia’s Future Project comes a measured study of the prospects for increased household borrowing. I’ve bolded the key passages. I would frame his dicussion differently but I largely agree with its conclusions.
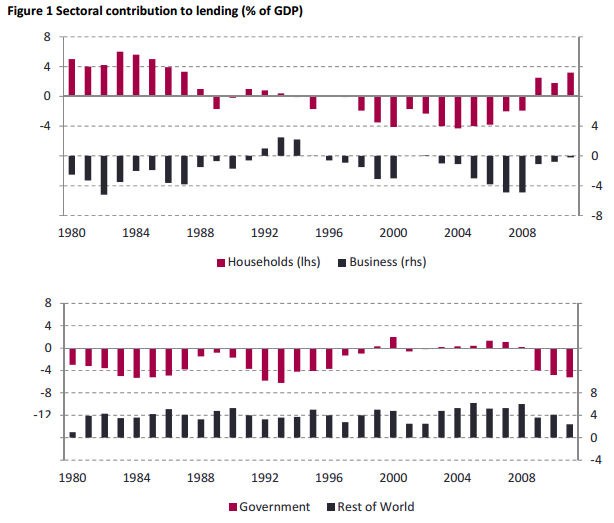
By historical standards, the unusual feature of Figure 1 above is the fact that the household sector borrowed heavily during the decade centred around 2000. Historically and in most economies the household sector has been a net saver, the corporate sector a net borrower, and the government relatively neutral. The period of increasing household leverage, most notably at the upper end of the income distribution, is only matched in our history by the run up towards the 1890s recession. Australian household leverage is towards the top end globally although over the past five years it has levelled out (Stevens 2011). Our central case assumption will be that households maintain their current level of borrowing as a proportion of their disposable income sustaining their current levels of gearing.
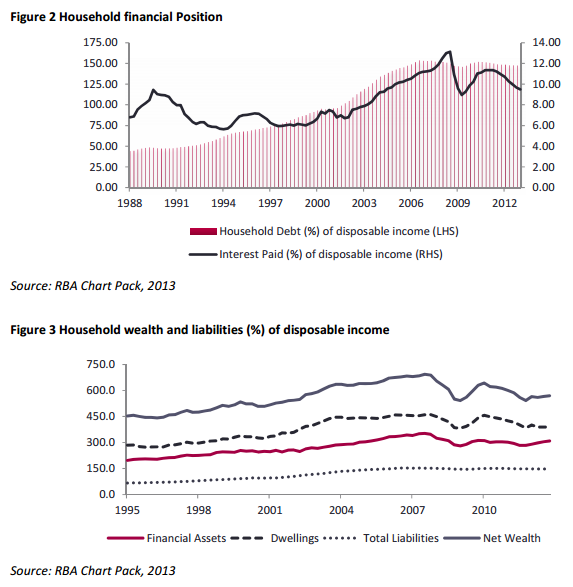
The increase in debt from about 1990 more than offset the reductions in interest rates resulting in a sharp rise in the debt servicing ratio of households. While their debt to income ratio stabilized after 2003, it was only after the large decline in interest rates post the financial crisis, that the debt servicing ratio has fallen. Households appear to have been happy to increase their debt prior to the crisis because of the large increases in the value of their assets (especially houses and shares). The subsequent decline in house prices, and the fall in the equity market, reduced the value of household assets. This has played an important role on the asset side of the balance sheet.
As is clear from Figure 1, faced with an increase in economic uncertainty, households have responded by stabilizing and then increasing saving. This, combined with the fall in interest rates has allowed households to move well ahead on the debt repayments. The combined impact of these factors has reduced aggregate household vulnerability to any economic shock, most notably in unemployment. The Funding Australia’s Future Project.
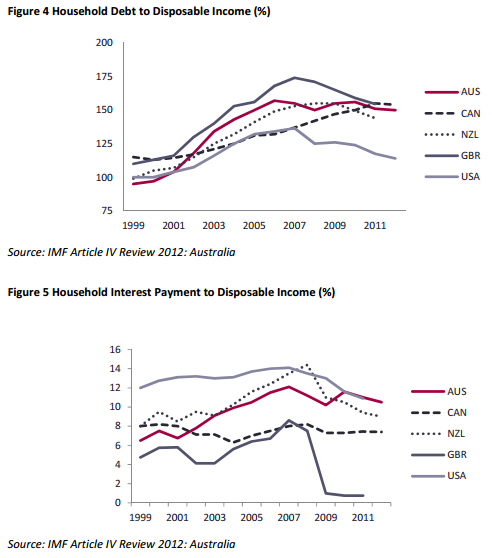
Rising household debt was a feature of most OECD countries over the past couple of decades, driven by the same drivers – lower interest rates and deregulation of financial markets. When measured by debt-to-income ratios (whether household income or GDP), Australian households moved from being very under leveraged by international standards in the early 1990s, to being towards the top end of the household debt table by global standards by 2010 (Figure 4). Using alternative measures of leverage, such as the debt-to-assets ratio, Australia’s leverage does not appear as high by global standards.
This reflects the large run-up that has taken place in house prices in Australia, although higher financial asset prices has also played a part reflecting the strong weighting of Australian saving portfolio directed towards equities.
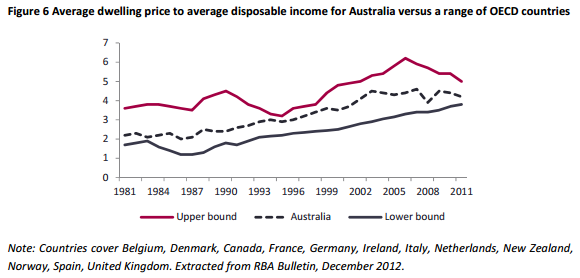
The bulk of the rise in household debt has been caused by mortgage debt, and the main driver of total mortgage debt has been the increased size of mortgages taken out. In this, the trend in Australian house prices does not appear very different from prices elsewhere. Figure 6 below tracks the upper and lower bounds of movements for a range of countries which suggests global explanations for the broad upwards shift: lower inflation and financial liberalization seem the most likely candidates (Ellis 2006).
In Australia’s case not all households participated in the move to pay more for houses. The evidence from the HILDA survey is that the bulk of the increase in mortgage debt held by Australian households has been undertaken by the wealthiest quintiles of the population.
Indeed, in 2010 the top income quintile accounted for almost half of total debt, while the top two quintiles accounted for over 70 per cent of debt. The survey also indicates that the largest increase in gearing has taken place in the wealthiest income quintiles (Connolly and McGregor 2011). Relative to countries with similar financial systems (the US, Canada, UK and New Zealand), the proportion of middle and higher income households that hold debt is about the same as Australia.
Our view of household borrowing as growing about in line with nominal income is based upon the view that households have adjusted to the new lower level of interest rates, and have reached a new equilibrium level. But there is no certainly that households will maintain their current levels of leverage.
International comparisons suggest that household leverage can be higher than our central case assumption. Canadians hold a higher level of debt than Australians relative to their income (Figure 4), although it is noticeable that their debt servicing ratio is lower than Australians’. And keeping current debt per head levels constant, a rise in the number of households borrowing towards the level of the UK would see an extra 5-10% of households hold mortgages. However the general pattern revealed in Figure 5 above suggests that for Australians to increase their leverage ratio, interest rates would probably have to be lower to allow them to maintain their debt servicing ratios at about the current level. An extended period of low, or even negative, real interest rates could be expected to lead to an increase in borrowing.
It is also clear that richer Australians have greater capacity to invest in property should they choose to do so.
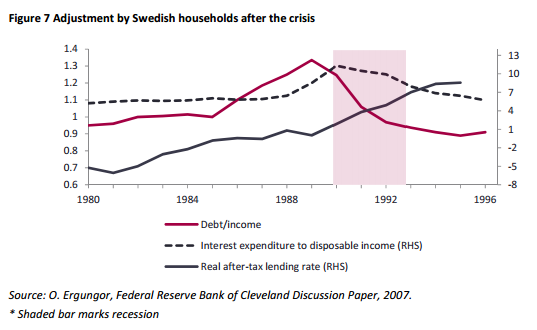
On the other hand declines in household leverage were also observed in the Netherlands, and the Nordic countries following their recessions of the early 1990s. In Sweden during its crisis of the 1990s the debt to income ratio fell from about 135% of household disposable income to under 90% with the adjustment taking about six years. The precursor was a large run up in household debt, a financial crisis, and then a significant economic recession.
Accordingly, the decline in household debt was both a demand side shock (households reducing demand for credit because of higher unemployment) and supply side shock (banks offering less credit as they tried to fix their balance sheets). (Remember that Sweden nationalised banks, and established a separate bad bank, to keep the banks operating as normally as possible: as the chart shows, rates rose: Ergungor 2007).
The high level of household debt in Australia means that households are more sensitive to expected changes in income. And with most of their debt sitting on bank balance sheets, this makes the banking sector more vulnerable to a significant rise in household debt, particularly if it coincides with a major correction to house prices. This scenario is one that is very widely recognized. Indeed, it is the basis for many of the stress tests run by the banks and APRA (Davis 2011). These stress tests typically also assume that there will be a substantial slowing of household credit growth, if not an outright decline.
Summary: We believe that the most likely course is that household demand for debt will broadly grow in line with income growth. The recent volatility in global economies and declining asset price growth is likely to have had a long-lasting and moderating impact upon household demand for credit.
This scenario assumes that there will be a moderate decline in the terms of trade over the next few years, and the policy and exchange rate response will be appropriate. In the event of a more substantial decline in the terms of trade, and without an offsetting exchange rate and policy response, there may well be a substantial decline in national income. What happens to nominal levels of debt obviously depends on what happens to inflation and underlying macro management (Gale and Orszag 2004).
It is easy to envisage scenarios for both higher and lower household leverage. Although households have had a ‘scare’, the fact that there has not been a sustained rise in unemployment means that the caution on spending exhibited post-GFC might be temporary. International comparisons also suggest that there is scope for the proportion of lower income households to hold mortgage debt to increase.
In effect while our central belief is that household demand for credit appears likely to stabilize at around the current levels, a movement (possibly significantly) in either direction is a decent possibility.
David Llewellyn-Smith is Chief Strategist at the MB Fund and MB Super. David is the founding publisher and editor of MacroBusiness and was the founding publisher and global economy editor of The Diplomat, the Asia Pacific’s leading geo-politics and economics portal.
He is also a former gold trader and economic commentator at The Sydney Morning Herald, The Age, the ABC and Business Spectator. He is the co-author of The Great Crash of 2008 with Ross Garnaut and was the editor of the second Garnaut Climate Change Review.