
One of the under-explored areas of Australia’s post-mining economy, is to what extent credit growth is able to accelerate. By driving towards public surpluses in a current account deficit economy, our pollies are inherently relying upon private credit growth to drive GDP.
The credit growth required to keep house prices running, to keep consumption humming and to keep the services economy investing, is lower than it used to be owing to borrowers paying down their debts faster. However, we will still need to see rising credit growth if the economy is going to be able to rebalance away from mining investment and support current standards of living.
At the moment, RBA credit aggregates have accelerated only modestly with total credit growth running at 4.8% annualised per month or 3.1% year on year:

On the other hand, deposits are growing now at around 6%.
As we know, APRA continues to insist that the banks lend dollar-for-dollar deposits-in, loans-out. It is obvious in the data. The following is a chart of Australian deposit-taking institutions’s assets (loans) to deposits spread:
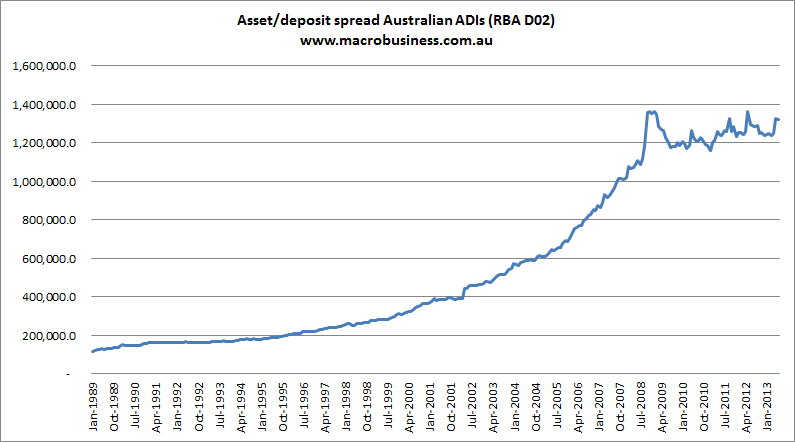
It hasn’t gone anywhere since 2009 and check out how fast it used to have to grow to keep the housing economy rolling. We can look at this another way by charting the growth in offshore liabilities which says virtually the same thing:
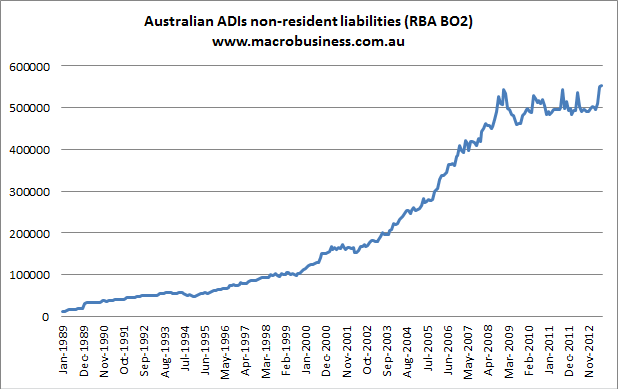
What this tells you is that APRA (and ratings agencies) are not letting the banks increase the absolute level of their offshore borrowing to pour into local loans. By extension it caps local credit growth, which can only grow as fast as deposits allow it to.
Where is the cap? It’s impossible to know given households are paying down debt faster than they used to, freeing up new credit capacity in the process. Other variables include off-balance sheet lending such as non-bank loans via securitisation or cash purchases of houses by foreign buyers. There is also the likelihood that deposit growth will fall further as national income comes under pressure with further declines in the terms of trade and interest rates. Nevertheless, a rough calculation says we’re near the cap now now. 4.8% credit growth for the system in the year ahead would add $15 billion in new assets. 6% growth in deposits would add $10 billion. We’re shifting past deposit-funded lending capacity as we speak.
It does not take much to see that $5 billion deficit get much larger. Everything else being equal, if credit growth were to accelerate to 6% and deposit growth fall to 4%, the deficit becomes $12 billion per annum. At 7% and 3% it’s out to $18 billion.
This is a far cry from the heady growth of yesteryear, but it would still represent 4% growth in offshore liabilities per annum.
It think (hope) that this is unlikely. It may be the RBA’s job to boost growth but it’s APRA’s job to protect financial stability and the shift apparent in the above charts looks structural to me. After all, once the borrowing resumes, how is prevented from rising?
