By Chris Becker
Another hurly burly week on macro markets. Here’s some charts that you should be watching at the moment, with my own notes and thoughts attached.
Remember, the following views are my own, do not constitute advice and are for information purposes only. As a trader, I may have positions in any or all of the below and their associated markets both long and short, on an intra-day, daily and weekly basis for my own account. Please seek advice from a licensed adviser before making any investment decisions.
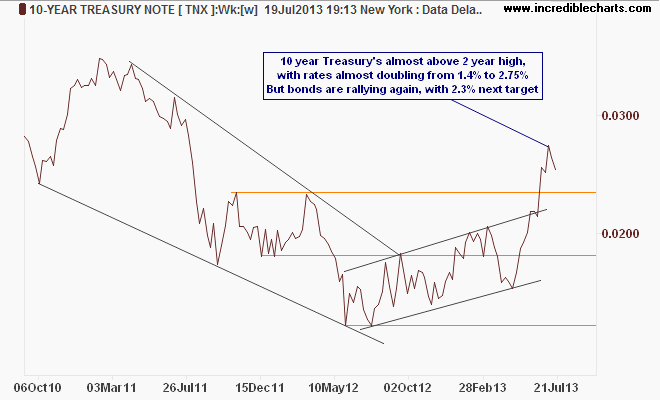
The US bond markets are showing some signs of a slowdown in selloffs (therefore rising yields), but this could be calm before the SepTaper storm:
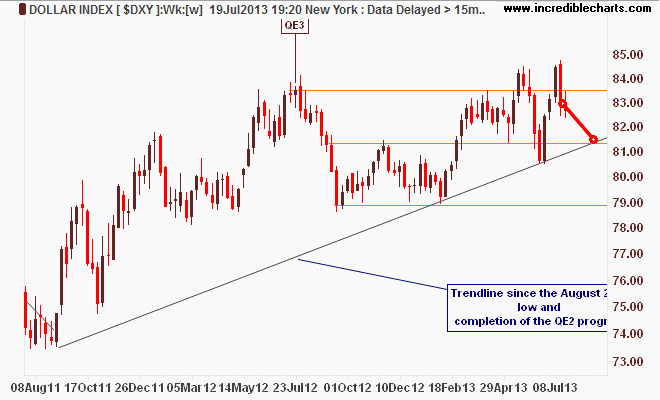
US dollar slipped again but this looks like a dip in the long running trend from late 2011:
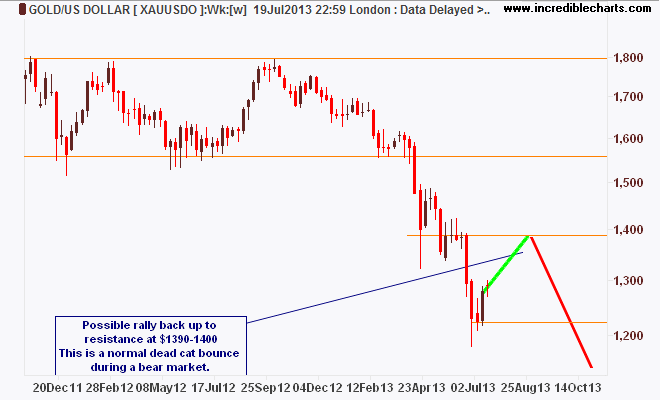
There is still no real case to be long in gold (unless you trade intraday). Here’s the weekly chart with a slim possibility of a dead cat bounce up to $1400USD per ounce:
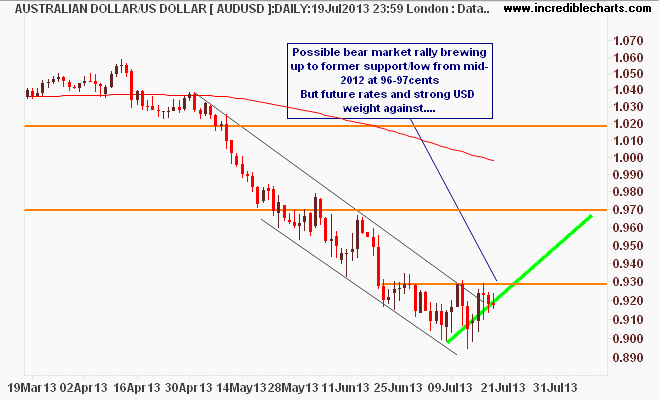
Aussie dollar remains under pressure, but continues to have potential to breakout strongly – which way though?. The last few weeks price action looks like a bottom, with a breakout above 93 cents back up to 96 cents only possible on a reversal in US strength. Next week’s CPI will be crucial for the AUD trajectory:
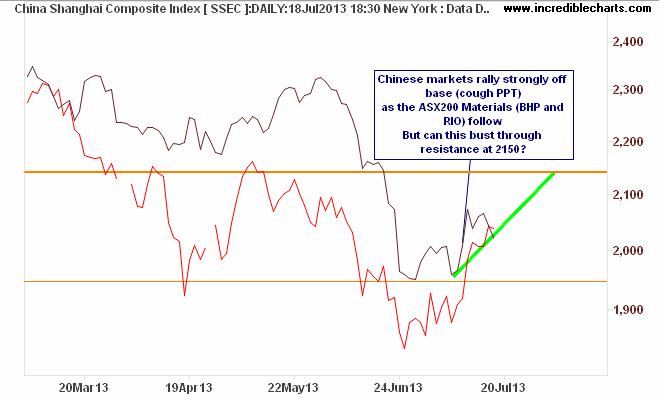
No follow through on Chinese markets which went nuts this week – check out the Shanghai Comp below, which the ASX200 Materials (in red) is following. Need to breach 2150 or so:
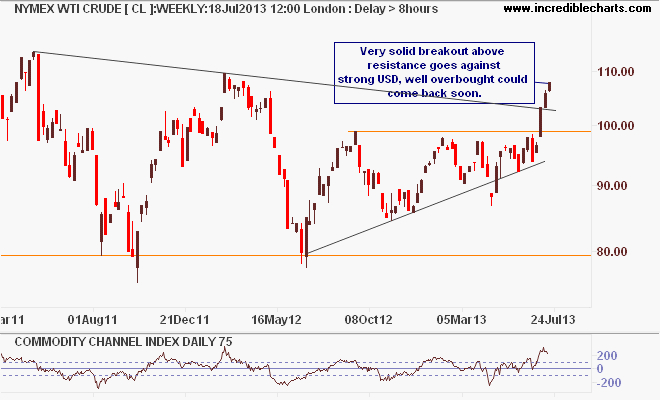
Crude oil continues its very strong breakout building above resistance, but this looks well overbought here:
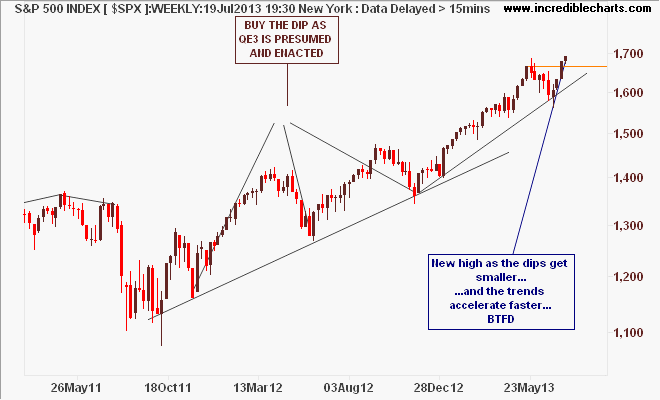
Another new high on the US stock market – the S&P500 – BTFD everytime – but this is bubbling…and squeaking ever higher!
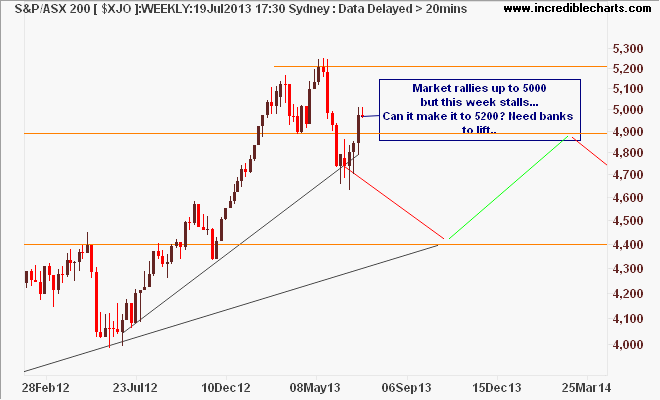
And finally, our local bourse. Putting aside the price action, did you know this? (BTW if you’re an Aussie stock investor/trader, you have to follow Assad on Twitter)
And the profit downgrades continue. Thats about 140 now in 11 weeks. Is anyone seeing a pattern here ? 🙂 #asx
— Assad Tannous (@AsennaWealth) July 19, 2013
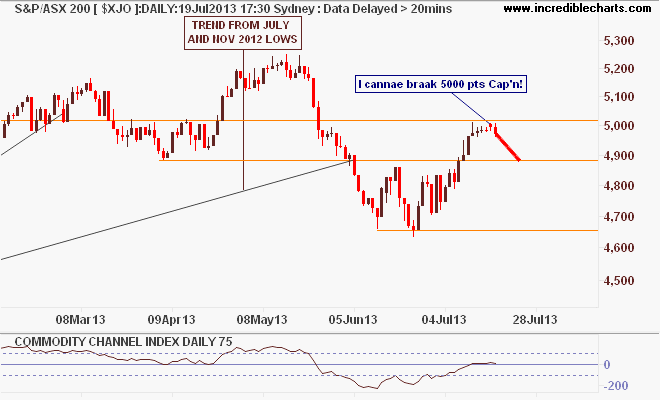
The price action to me indicates a temporary bottom at the 4700 level, but an equally short term resistance at 5000 points for the ASX200. Again, financials need to lift the bourse – another rate cut in August would do that nicely, bubbling the bourse higher: