

RP Data has released its daily index results for 31 July, which has enabled me to calculate the dwelling values results at the 5-city level, which covers the five major capital city markets.
According to RP Data, dwelling values nationally rose by 1.52% at the 5-city level, with gains recorded in Sydney, Melbourne and Perth (see next chart).

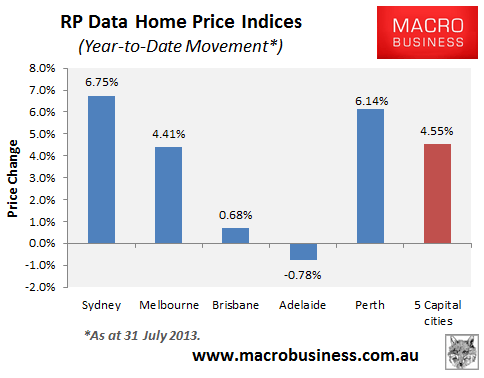
Since the start of the year, values have risen by 4.55% at the 5-city level, with all major markets except Adelaide experiencing increases (see next chart).
Over the past 12 months, values have risen by 4.88% at the 5-city level, with all major markets experiencing increases (see next chart).

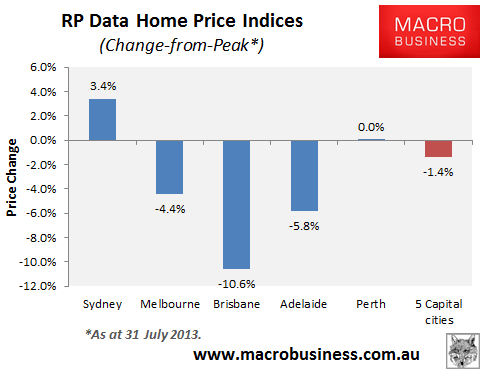
Values are down -1.4% since peak at the 5-city level, with most major capitals in negative territory (see next chart).
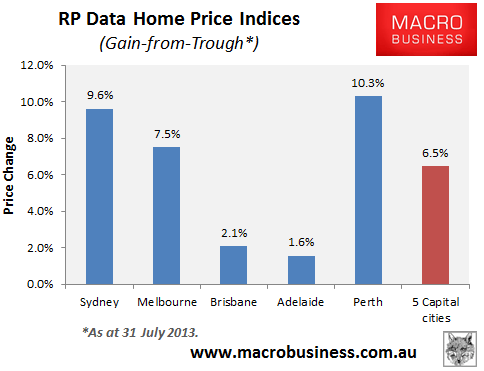
However, major capital home values have now gained 6.5% since bottoming in May 2012, with all capitals rebounding (see next chart).
Finally, the below chart shows the monthly movements since the daily index was implemented in January 2012:
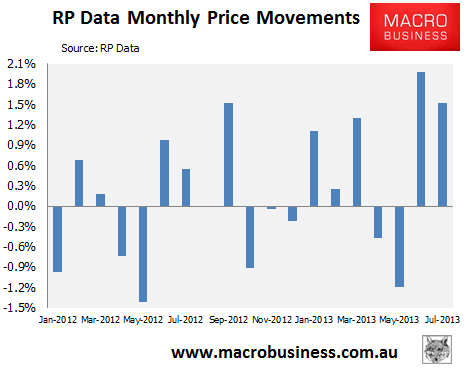
As noted previously, my advice is to not read too much into short-term movements in the RP Data index. The index is inherently volatile and not seasonally adjusted, hence the large monthly swings shown above. There is also evidence suggesting the RP Data daily index is a lagging indicator for the quarterly ABS house price series (see here). Given the big rises over June and July, and the index’s inherent volatility, I would not be surprised to see some pull-back in values over coming months, as happened in April and May.
Later on today or tomorrow, RP Data will release its full report, which includes price results for the other major capitals, namely Hobart, Canberra and Darwin.
unconventionaleconomist@hotmail.com
