The Australian picks up a useful story today on the move by the Bank of International Settlements on the use of internal risk weighting asset models to lower capital reserves. Long term readers will know that this is the dirty little secret at the heart of Australian banks’ ability to stretch their leverage.
THE banks’ long journey to shore up capital levels may be far from over as global regulators crack down on leverage and how lenders assess risk, potentially eating into bonus payouts by the big four to shareholders.
In the latest regulatory cloud to emerge over the industry, the Basel Committee found there was inconsistency across countries in the level of risk banks assigned as judged by the probability of default.
The risk weighted assets study is part of a push to ensure consistent implementation of the new Basel III rules designed to strengthen the global financial system after the financial crisis. Late last week Stefan Ingves, chairman of the Basel Committee, said the considerable variation “warrants further attention”.
Although the committee didn’t look at retail assets, any changes to the amount of capital banks have to hold against mortgages would be an issue for the Australian banks, given it is their largest asset base.
Here are the key extracts from the BIS report, in which individual bank identities were concealed to protect the innocent but it is highly likely that Australia’s big four banks are on this list:
Advertisement
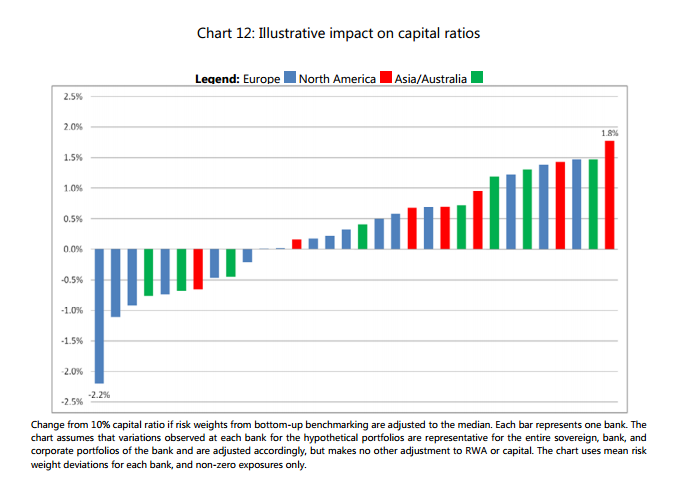
At one extreme (at the far left of Chart 12), one bank would report a capital ratio 2.2 percentage points lower than the 10% benchmark if its risk weights were adjusted to reflect the cross-bank benchmark risk estimates; this bank assigns PD and LGD estimates that tend to result in risk weights below those of other banks and would therefore see its capital ratio decrease if it used industry median credit risk parameters. At the other extreme (far right of the chart), one bank would report a capital ratio 1.8 percentage points higher, because applying the benchmark risk weights would reduce its RWA.
These are the extremes at either end of the distribution; 22 of the 32 banks lie within 1 percentage point of the 10% benchmark used in the chart, and only two of the banks show a capital ratio reduction exceeding 1 percentage point.
The differences in capital ratios scale up or down directly with the benchmark capital ratio used, assumed to be 10% for the chart. Thus, an equivalent statement of the conclusion is that if the variation in risk weights observed for the HPE exposures is representative of the sovereign, bank, and corporate portfolios at these banks more generally, such variation could cause capital ratios for otherwise identical banks to differ by up to 22% from a given initial capital ratio. On average for the 32 banks, the deviation (either positive or negative) is 8%.
Separate analysis suggests that a bank with a portfolio-wide PD deviation of half a rating grade and LGD deviation of 4 percentage points would exhibit a capital ratio deviation approximately 0.6 percentage points above or below a given benchmark capital ratio. About half of the banks differ from the benchmark by less than 0.6 percentage points. 38 Regulatory consistency assessment programme (RCAP) – Analysis of risk-weighted assets for credit risk in the banking book.
The analysis in Chart 12 assumes that the extent to which a bank’s risk weights deviate from the cross-bank median benchmark as observed in the HPE for the sovereign, bank and corporate portfolios applies only to those portfolios, but not to other parts of the banking book; thus, the implicit assumption is that each bank looks “average” with regard to other credit types (such as retail credit) and other risk types. On average, sovereign, bank, and corporate portfolios account for approximately 40% of total credit RWAs for the HPE banks.
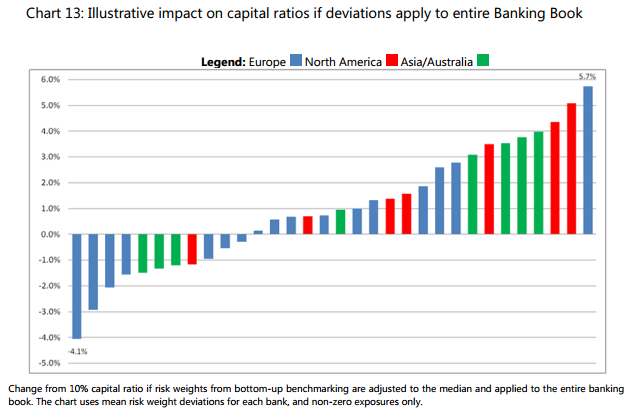
An alternative approach to assessing the impact of those deviations is to assume that the average risk weight deviation for all other parts of the banking book (such as retail credit) at each participating HPE bank matches the weighted average deviation for the wholesale exposures covered in the HPE; in effect, the bank is assumed to deviate from the mean in other credit types in a way that corresponds to its observed treatment of the three wholesale asset types. In that case, the potential impact on capital ratios is substantially larger (Chart 13).
In general terms, the impact from Chart 12 is scaled upward for Chart 13 by the ratio of total credit risk RWAs to the combined RWAs of sovereign, bank, and corporate credit. However, there are important reasons why this result should be viewed with caution:
the rank-ordering of banks is not the same for the three HPE portfolios assessed; this suggests that a simple “scaling up” approach may not appropriately capture differences in rank ordering across other, more diverse, portfolio types.other credit risk categories may have more extensive data histories, which may allow for more accurate quantitative calibration, and less need for adjustments based on expert judgement. \
Change from 10% capital ratio if risk weights from bottom-up benchmarking are adjusted to the median and applied to the entire banking book. The chart uses mean risk weight deviations for each bank, and non-zero exposures only. To provide a more realistic measure of the full impact on banks’ capital ratios, an HPE analysis would be needed that covers the entire banking book, linked to similar exercises for market risk and operational risk. The Committee plans to extend the HPE analysis accordingly in future work with a view to providing a more complete assessment.
We might take this as good news. The green bars which will represent the Australian banks (among others) do not appear to be short of capital. Indeed, the second chart raises the possibility that they have surplus capital across the banking book with four big green bars in the positive (or not!). But as the BIS says, we should be cautious here. Big four Australian banking books are dominated by mortgages. Extrapolating risk weighted capital from the corporate and sovereign books is unlikely to provide an accurate picture of the capital position for the retail book given the risk weightings are derived from historical experience and Australian banks have significant history of corporate defaults but very little of retail defaults.
The further work of the BIS in this area is going to be very interesting indeed.
David Llewellyn-Smith is Chief Strategist at the MB Fund and MB Super. David is the founding publisher and editor of MacroBusiness and was the founding publisher and global economy editor of The Diplomat, the Asia Pacific's leading geo-politics and economics portal.
He is also a former gold trader and economic commentator at The Sydney Morning Herald, The Age, the ABC and Business Spectator. He is the co-author of The Great Crash of 2008 with Ross Garnaut and was the editor of the second Garnaut Climate Change Review.