
Cross-posted from Mark the Ballot.
The change of prime minister has had an unexpected impact on the polling data and on my attribution of house effects. This impact makes the polls particularly difficult to interpret at the moment.
The critical question is how much of a bounce did Kevin Rudd bring to the polling fortunes of the Labor party. To answer this question, I will look at the average two-party preferred Labor vote share for each polling house. I will take the polls in May and June (prior to 26 June) and compare them with the polls since then.
| House | Before | After | Bounce |
|---|---|---|---|
| Essential | 45.3 (n=7) | 48.0 (n=3) | 2.7 |
| Galaxy | 45.5 (n=2) | 49.0 (n=1) | 3.5 |
| Nielsen | 44.5 (n=2) | 50.0 (n=1) | 5.5 |
| ReachTEL | 42.0 (n=1) | 48.0 (n=1) | 6.0 |
| Newspoll | 43.3 (n=4) | 49.5 (n=2) | 6.2 |
| Morgan (multi) | 44.5 (n=8) | 51.7 (n=3) | 7.2 |
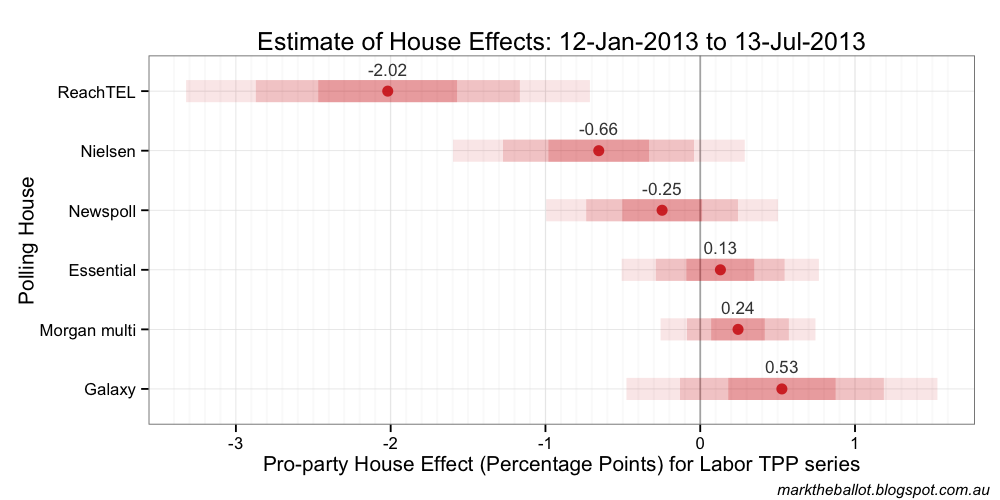
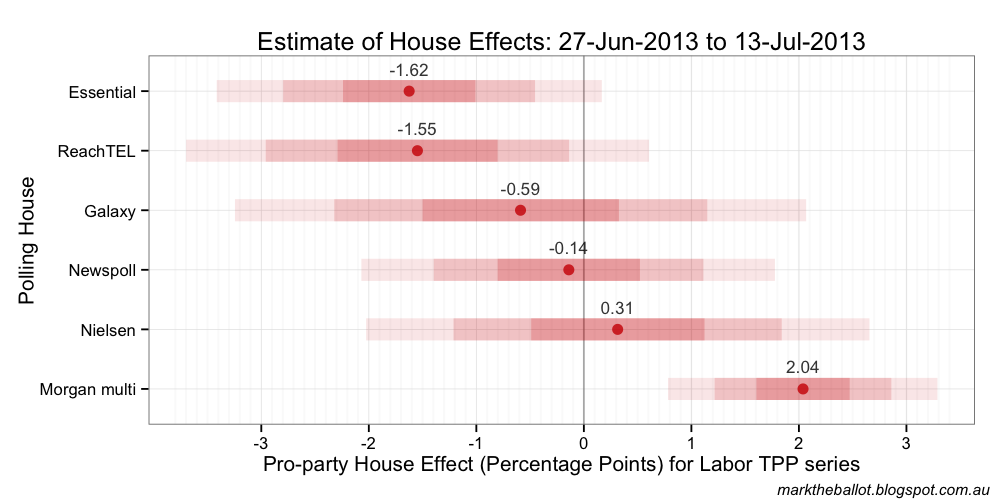
While this is a little rough and ready (some might say arbitrary), it reveals substantial differences of view between the polling houses on the boost Kevin Rudd’s return gave Labor.
Of note, Essential has gone from being among the most Labor leaning polling house to among the most Coalition leaning House.
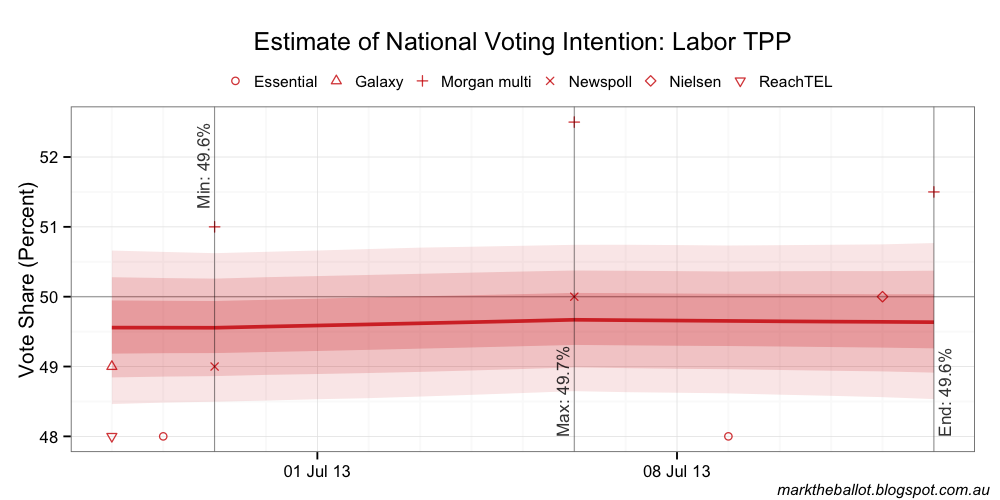
The discontinuity model I had been using in recent weeks assumed the polling bias during the reigns of prime ministers Gillard and Rudd remained much the same. Clearly this is not the case. While I now have serious doubt about the utility of these charts, for reasons of historical continuity, they follow:
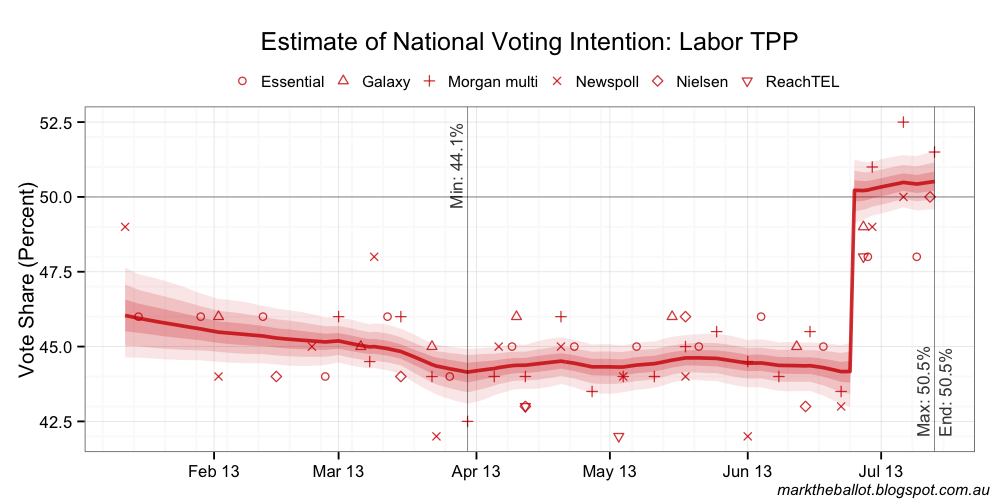
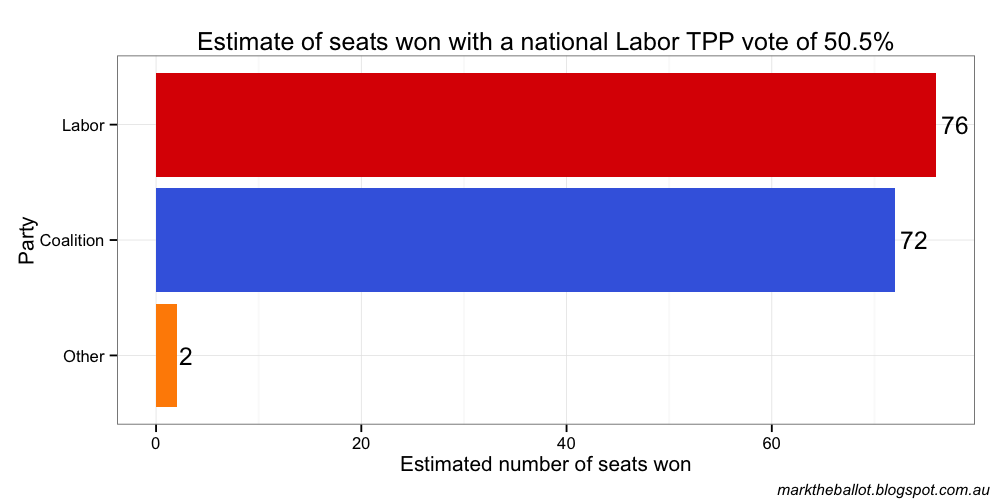
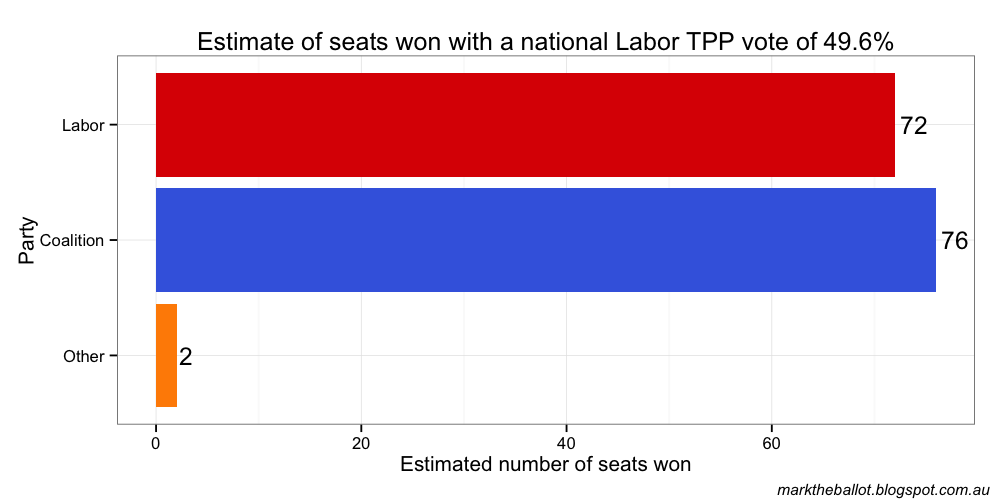
If we limit our analysis to the data since the second ascension of Kevin Rudd, the story is a little different. This analysis suggests a 75 per cent chance that the Coalition has 50 per cent or more of the TPP vote share, and a 25 per cent chance that Labor is in front.
At this stage I would urge some caution in interpreting the second Rudd-era polls. As more polling data becomes available, we will be able to better calibrate our models.
