
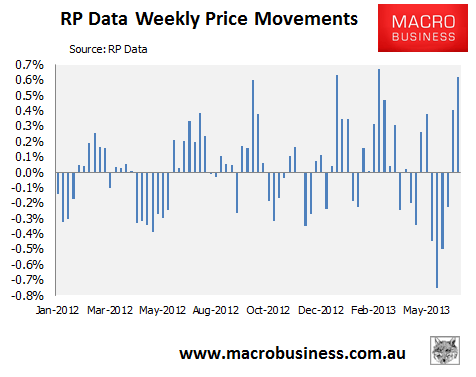
In the week ended 20 June 2013, the RP Data-Rismark 5-city daily dwelling price index, which covers the five major capital city markets, recorded a large 0.62% increase. It was the second consecutive weekly rise in values (see next chart).
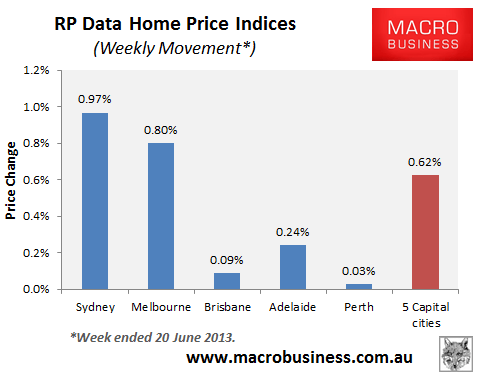
All capital cities recorded value increases (see next chart).
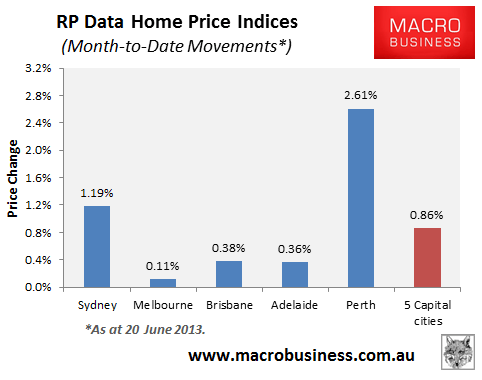
Values are up 0.86% so far in June, with all major capitals recording increases (see next chart).
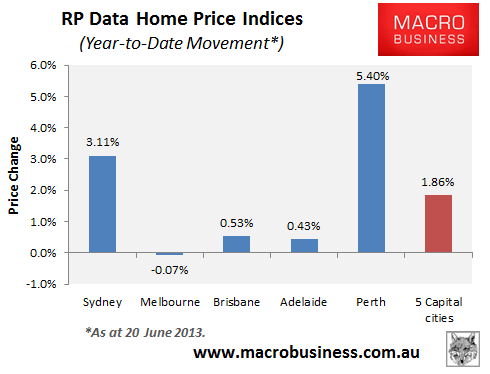
Since the end of last year, home values have risen by 1.86% at the 5-city level, with all markets except Melbourne experiencing gains (see next chart).
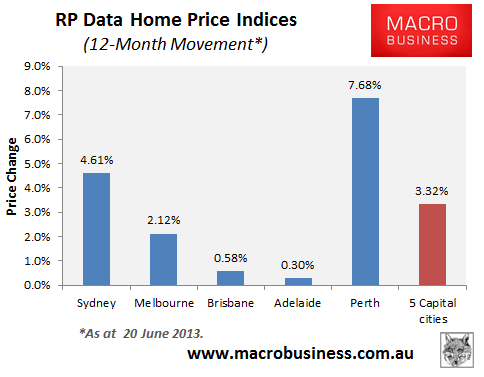
Over the past 12 months, values have risen by 3.32% at the 5-city level, with all major markets experiencing increases (see next chart).
The next chart plots the daily movements on a 14-day moving average, in order to smooth volatility. As you can see, the uptrend looks to have resumied across most markets, although Melbourne and Brisbane appear to have stalled (see next chart).
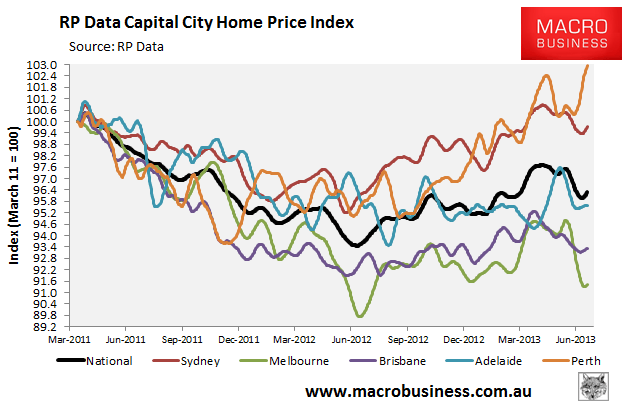
Values are down 3.9% since peak at the 5-city level, with all major capitals in negative territory, but Sydney and Perth almost recovering their lost value (see next chart).

However, major capital home values have now gained 3.7% since bottoming in May 2012, with all capitals rebounding (see next chart).

unconventionaleconomist@hotmail.com
