The AFR has a couple of pretty ordinary takes on the ASX’s inflating bank bubble today. Why are they ordinary? Because it’s “he said, she said” journalism without a jot an analysis. The first story is a sell job:
It is because the Australian share market is at multi-year highs and in the past a sustained upward movement was driven by the growth sectors of the market, like the materials and resources, and what is different now is that upward momentum is being driven by high yielding defensives,” Ms Lee said.
The performance of attractive high-yield stocks, particularly the major banks, which are currently returning a net dividend yield of around 5 per cent, has triggered debate about whether the trend is here to stay for the longer term.
“I believe the next decade will be more about companies with real assets, earnings and growth. This includes the financial sector,” said Alex Leyland, portfolio manager at Leyland Private Asset Management.
Real assets? Mortgages? Hmmm.
Advertisement
Anyway, the second story at least identifies the issue if not the causes:
Australian bank shares have entered a risky great bubble territory similar to the peak of the internet stock boom that ended in a crash last decade, leading fund managers and the country’s top-rated bank analyst have warned.
As share prices of the big banks surge to record highs, Emilio Gonzalez, chief executive of BT Investment Management, majority owned by Westpac Banking Corp, said his 25 years’ experience in markets suggested soaring asset prices generally led to a correction.
“That happened in 1999-2000 with the internet boom and I’m seeing similar symptoms [among banks] which throws up a few red flags,” he said. “Banks are a leveraged play on the economy and that shouldn’t be forgotten, so hopefully as people chase those yields they have a diversified portfolio.”
True enough. But the issue with these stories is that, as usual, they offer no context. Sure, banks are rising on a chase for yield. But why? If you don’t ask that then how can you act?
The answer is financial repression. So if you’re interested in chasing banks higher then you need to ask will it last, why, and what are its inherent risks? Thankfully ANZ has delivered a fantastic macro note that delivers some answers. First, for the globe:
Advertisement
Our core investment view is that the global economy remains in an extended stable nominal GDP growth environment anchored by G3 central banks. This environment will continue to support global yield convergence with risks absorbed by central banks. The ANZ baseline is that cheap financing will support a synchronised recovery in global capital goods spending towards end 2013.
To date inflation expectations have remained anchored and this has supported the effectiveness of central bank policy. A sustained behavioural shift to income over growth could become self-reinforcing if capital spending is shelved. Growth could then skid below the nominal GDP zone that supports riskier yield exposures.
Right on. And now for Australia:
The resilience of financial risk appetite and inflation expectations through an extended period of steady nominal growth (as was the case in 2012) remains the key driver of markets.
In our strategy feature this week we analyse this thematic through the prism of Australian capital markets (the safe high yielding Australian equity and corporate bond markets).
The Australian equity market is essentially a barbell between global materials (mining) companies (leveraged to commodities via Chinese growth) and AA rated global banks (high quality financial assets that offer elevated safe yield). The Australian dollar clearly straddles both asset classes, although since the Q3 2012 and the Fed open ended asset purchase program it appears to be tilting more towards safe financial yield rather than commodity inflation.
Overall in our strategy feature this week we identify the core theme driving markets as the continued transition from the commodity super cycle to the yield super cycle anchored by a stable moderate nominal GDP growth cycle.
We date the peak in the commodity super cycle in late 2011 (likely earlier if we abstract from the large Chinese fiscal stimulus). Since late 2011 we have observed two commodity min-cycles. However, the peak in each mini cycle has been slightly lower than the previous high while mini cycle troughs tend to be lower.
In contrast to the steady unwind of the commodity super cycle since late 2011, the financial asset super cycle (the global race to the bottom in yields) has printed each peak above the previous high while mini cycle lows have been shallower.
AUSTRALIAN EQUITIES: THE GREAT DIVIDE BETWEEN INCOME AND GROWTH WIDENS
We identify two structural shifts in the Australian equity market (and global capital markets) post the global financial crisis.
1. In late 2011 we observed a large structural capitulation in mining equity stocks that marked the peak of the commodity super cycle. Subsequent to the capitulation we have observed two mining mini cycles in late 2011 and again in late 2012. Both were a sell opportunity.
2. Since Q3 2012 (Fed announces open ended asset purchases) we have observed a relentless shift to global yield compression reflected in the Australian bond and equity markets. Each dip has marked a buy on the dip in yield.
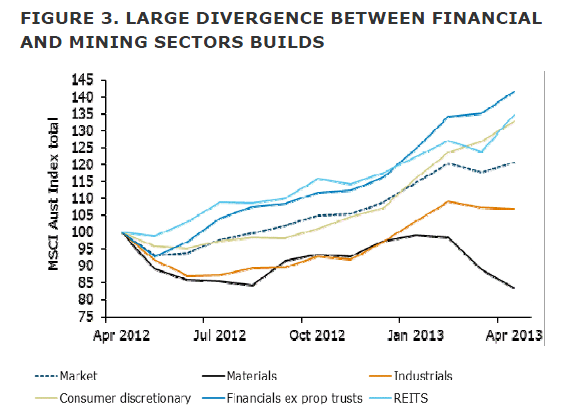
Subsequent to the collapse in the mining index in late 2011 returns to the materials sector lagged the returns to financial assets through to September 2012. However, since September 2012 when the Fed announced its open ended asset purchases the returns to mining have fallen sharply while the returns to the financial sector have surged.
Clearly the market does not expect that open ended Fed purchases will fuel commodity inflation (yet). Figure 3 clearly shows that since April 2012 the total return Australian financial stocks have surged by some 40%. Over the same period returns to mining and materials have slumped by 15%.
The gap between financials and mining has widened sharply since Q3 2012 when the Fed announce its open ended asset purchase program.
In short, the race to the bottom in global yields spurred by the Fed and now the Bank of Japan has trumped the commodity super cycle since late 2011.
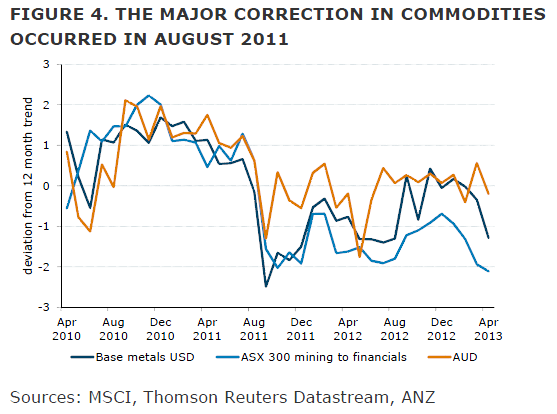
In figure 4 we plot the relative performance of the Australian materials sector to financials against base metals (in USD) and the Australian US dollar cross since April 2011. This chart clearly shows the collapse in materials and base metals in August 2011 was largely ignored by the Australian dollar that has disconnected from commodities and is trading more in line with high safe yield.
Subsequently, we have observed two commodity mini-cycles with lower peaks in December 2011 and
December 2012. Both cycles were truncated.
Overall, the peak in commodities occurred in Q3 2011 and since that time the pendulum has swung to financial assets and global yield convergence.
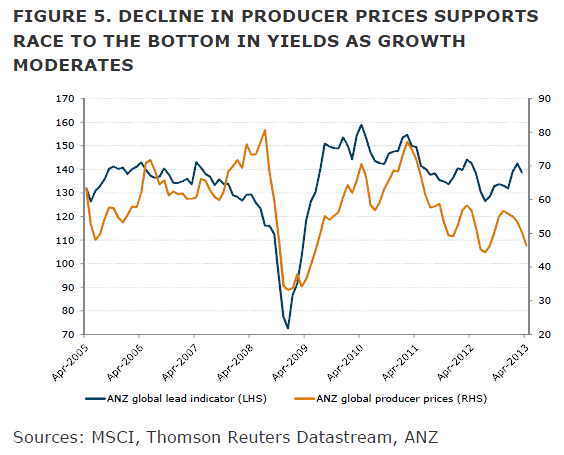
This pattern broadly tracks the shifts in the level of both the ANZ global lead indicator and the ANZ producer price index since 2010 (Figure 5). The twin peaks in producer prices occurred in July 2008 and again in March 2011. To generate a peak above these levels we need to see the level of the ANZ global lead indicator above 150 for a sustained
period (Figure 5).
The announcement of the Federal Reserve open ended asset purchase program in Q3 2012 in conjunction with a large decline in the ANZ producer price index has driven the race to the bottom in global yields including Australian financial equities that offer high yield.
STRONG RETURNS TO AUSTRALIAN EQUITIES PRIMARILY DRIVEN BY YIELD COMPRESSION NOT EARNINGS
As described in the previous section robust returns to Australian equities have primarily been driven by financial yield exposures and yield convergence (PE re-rating) rather than strong earnings growth.
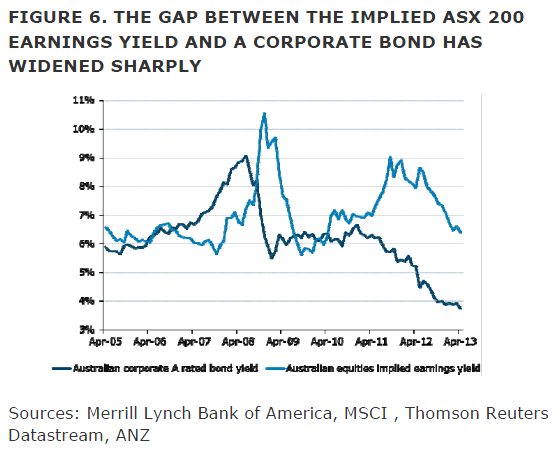
The decline in the implied earnings yield for the ASX 200 has largely coincided with the late 2011 correction in materials and mining and the subsequent race to the bottom in global yields spurred by the Fed open ended purchase program.
Indeed, the implied earnings yield for the ASX 200 in December 2011 was around 9% as compared with 6.7% in April 2013. Over the same period the yield of an A rated corporate bond has fallen from 6% to 3.9%.
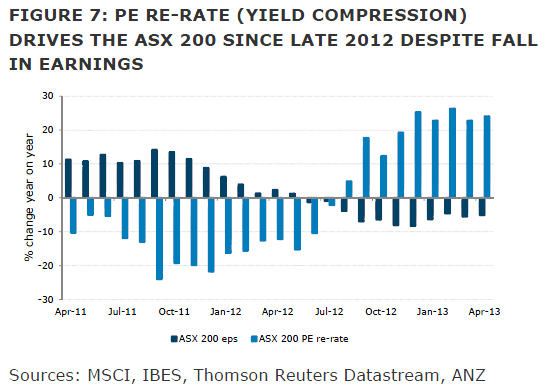
The decline in the implied earnings yield for the ASX 200 has been driven by sustained PE re-rating since late 2012. For the ASX200 in total the PE has risen even as earnings per share continue to fall. The wedge between the PE decline and decline in earnings per share is clearly shown in Figure 7.
The inflection point between earnings growth as a driver of equity returns and PE re-rate (yield compression) occurred around Q3 2012 in line with the Fed announcing its open ended asset purchase program. Indeed, over the year from April 2012 to April 2013 the ASX 200 PE is up around 25%, while earnings per share for the ASX 200 are
down around 6%. The decline in earnings is heavily tilted to the mining sector.
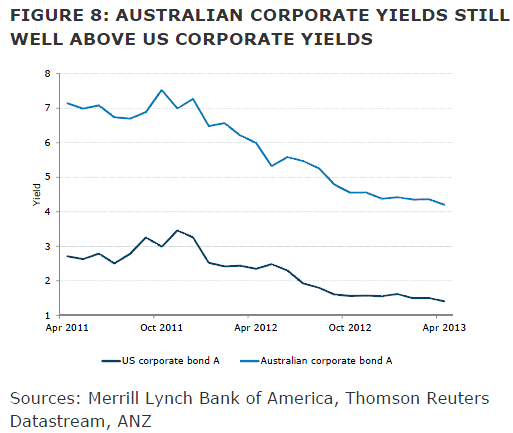
Despite the large decline in Australian yields since late 2012 Australian A rated corporate bonds still offer a yield around 4.3% as compared to 1.8% for an A rated US corporate bond.
AUSTRALIAN FINANCIAL YIELDS HAVE FURTHER SCOPE FOR COMPRESSION
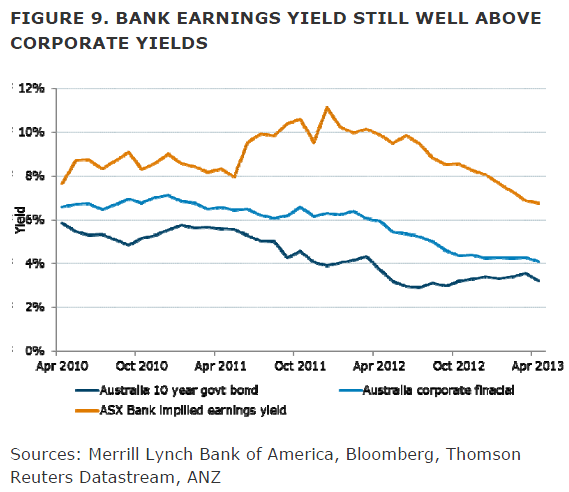
A sizeable wedge remains in place between the implied ASX 200 bank earnings yield around 7% and the corporate financial bond at 4% and the Australian government yield at 3.1%.
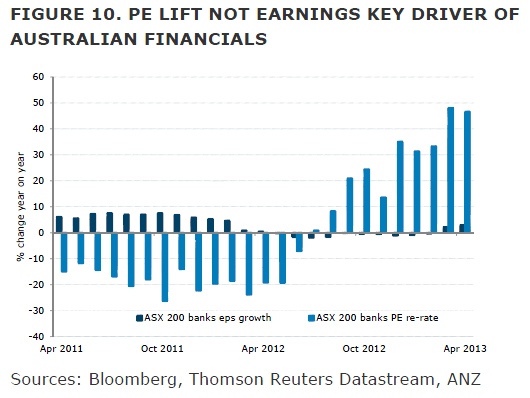
The peak in the implied bank earnings yield was around 11% in late 2011. Clearly the gap between the implied earnings yield and sovereign yields was excessive in late 2011 through to Q3 2012. The Fed open ended asset purchase program provided the catalyst for the massive yield compression rally. Figure 10 clearly shows the powerful yield
compression that is supporting bank equity returns.
DEFLATION IS THE ULTIMATE RISK TO THE YIELD CONVERGENCE SUPER CYCLE
With global economic momentum easing we consider disinflation/deflation risk outweigh inflation for the foreseeable future. To date markets remain in a sweet spot for financial assets with G3 central banks providing strong support and inflation expectations and nominal growth modest but not collapsing to sustained deflation. We consider it has been the resilience of inflation expectations that has enhanced the effectiveness of G3 central bank policy.
A period of sustained deflation and weakening nominal GDP would lift debt to GDP and for non-safe haven sovereign yields that rely on foreign financing would increase the cost of borrowing. Moreover, increased sovereign borrowing would crowd out private sources of capital.
Overall, we see limited risk that deflation risk will emerge as a new thematic. Recent moves by the EZ to ease fiscal tightening; clear signs that the drivers of US growth have broadened and sustained G3 policy support are all acting to support inflation expectations. However, a synchronised lift in global growth momentum supported by capital spending on current cheap financing will need to evolve by 2015 to prevent nominal GDP skidding to the bottom of the current search for yield comfort zone.
This really is an excellent piece of analysis. I have only two points to add.
Advertisement
The first is that characterising this as a shift from one “super cycle” to another is overly comforting. It is possible that Australia will sail through flat seas from an historic real assets boom into a second financial assets boom but it’s not probable. Indeed, if the commodities super cycle comes apart fast enough, as I think it will, then the second of ANZ’s “super cycles” will become just another bubble as falling Australian income undermines asset prices, bad debts begin to rise and the bank yields that ANZ is celebrating come under some serious strain.
The second point is that there is an inflationary risk to ANZ’s yield “super cycle” thesis. I’m not talking about global inflation which I still see as many years away, weighed down by epic global overcapacity. I mean local inflation, that rises if the Australian dollar falls quickly enough. Of course, if the ANZ is right, the dollar will never fall. But that most definitely assumes that the commodity “super cycle” unwind is staged not sudden nor anything else pushes down the Aussie dollar.
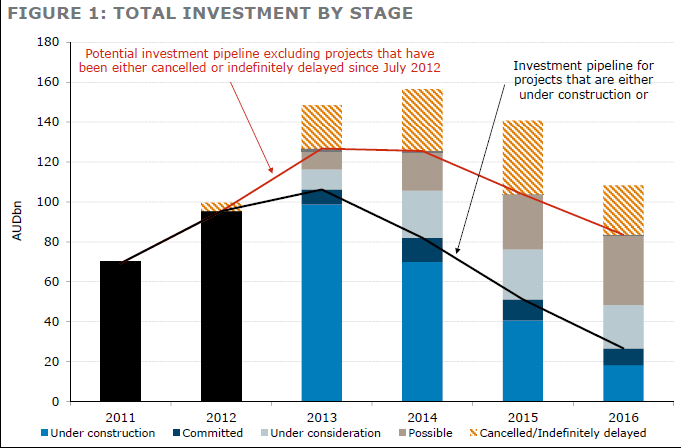
I suggest ANZ consult its own mining major projects report for insight into that possibility. This is not a gentle decline:
Advertisement
So, what’s the upshot? In couching the “yield compression” shift as a “super cycle”, ANZ is not discounting enough risk in the commodity unwind. The dollar will fall if the terms of trade keeps falling, which remains my base case. If it does then the bank bubble is going to burst. When? Perhaps two rate cuts away.
My preferred strategy remains dollar exposed industrials with some defensives thrown in. The MB top ten (be aware the actual analysis and picks is now dated) is up 33% since August 2012, well ahead of the ASX 200, and the banks. And it is naturally hedged if the bank bubble bursts.
David Llewellyn-Smith is Chief Strategist at the MB Fund and MB Super. David is the founding publisher and editor of MacroBusiness and was the founding publisher and global economy editor of The Diplomat, the Asia Pacific’s leading geo-politics and economics portal.
He is also a former gold trader and economic commentator at The Sydney Morning Herald, The Age, the ABC and Business Spectator. He is the co-author of The Great Crash of 2008 with Ross Garnaut and was the editor of the second Garnaut Climate Change Review.