

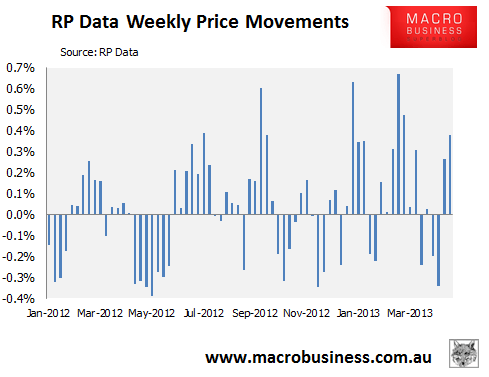
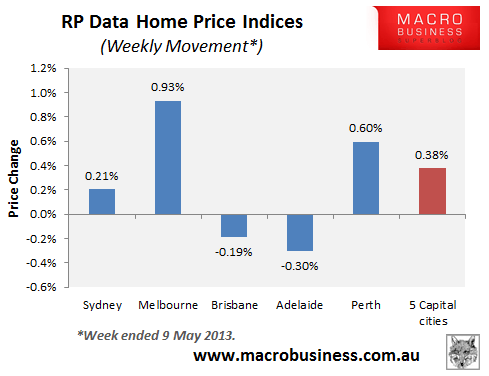
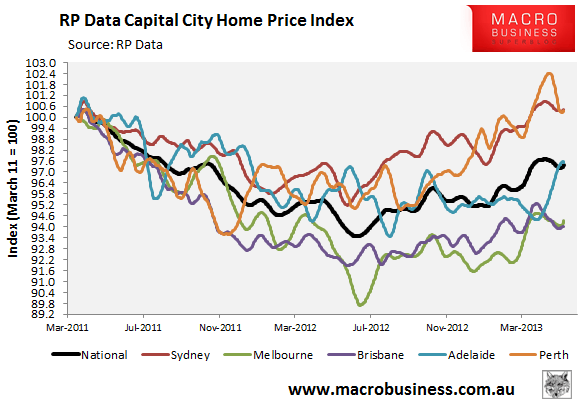
In the week ended 9 May 2013, the RP Data-Rismark 5-city daily dwelling price index, which covers the five major capital city markets, recorded a 0.38% increase, which followed last week’s 0.26% rise (see next chart).
Results were mixed, with Sydney, Melbourne and Perth recording value increases, and Brisbane and Adelaide recording falls (see next chart).
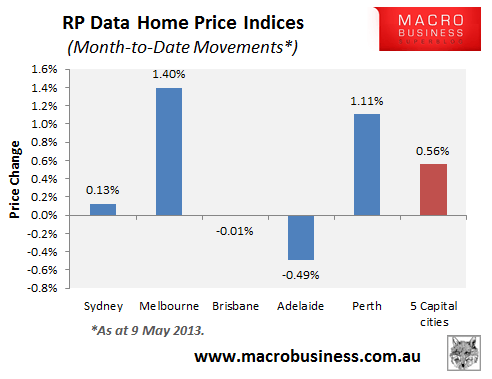
Values are up by 0.56% so far in May at the 5-city level, led by strong gains in Melbourne and Perth (see next chart).
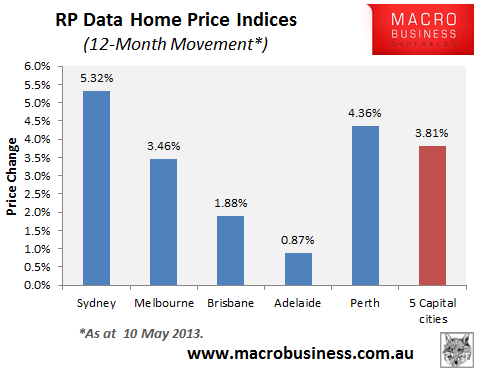
Over the past 12 months, values have risen by 3.81% at the 5-city level, with all major markets experiencing increases (see next chart).
The next chart plots the daily movements on a 14-day moving average, in order to smooth volatility. As you can see, all major capitals except Adelaide are in an uptrend (see next chart).
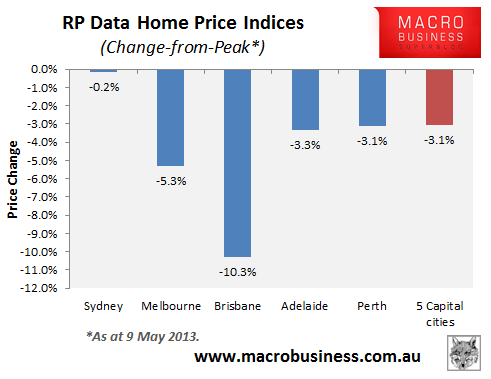
Values are down -3.1% since peak at the 5-city level, with all major capitals in negative territory, but with Sydney only marginally under water (see next chart).
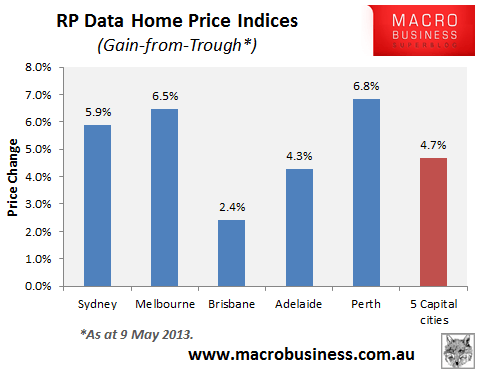
However, major capital home values have now gained 4.3% since bottoming in May 2012, with all capitals rebounding (see next chart).
unconventionaleconomist@hotmail.com
