

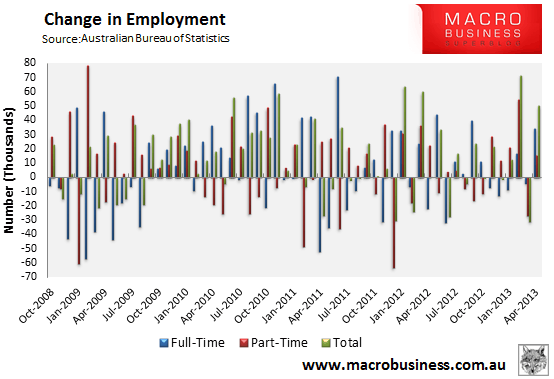
As summarised earlier by Houses & Holes, the Australian Bureau of Statistics (ABS) has released labour force data for the month of April, which reported no change in the the headline unemployment rate (i.e. still 5.5% after March’s figure was revised down from 5.6%), but a seasonally-adjusted 50,100 (0.4%) increase in jobs across the economy, with a full-time employment increasing by 34,500 and part-time employment increasing by 15,600.
The result beat analysts expectations, which had forecast that 11,000 jobs would be created over the month and an unemployment rate of 5.6%
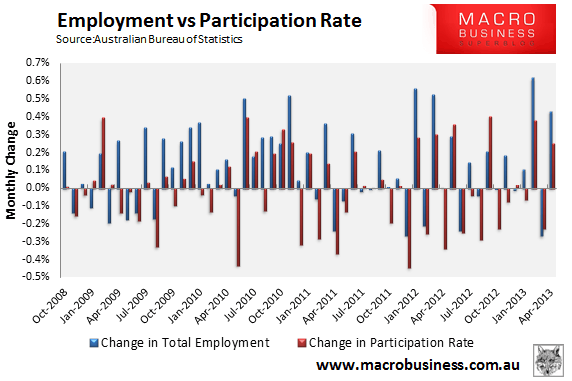
The headline unemployment rate would have improved were it not for a 0.2% increase in the participation rate to 65.3% (see below charts).
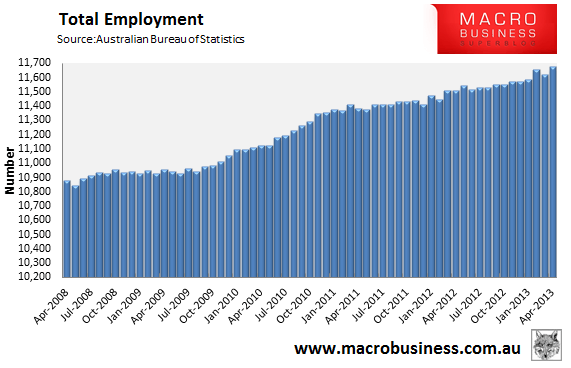
The result continues the steady uptrend in total employment that has been in place since late-2010 (see next chart).
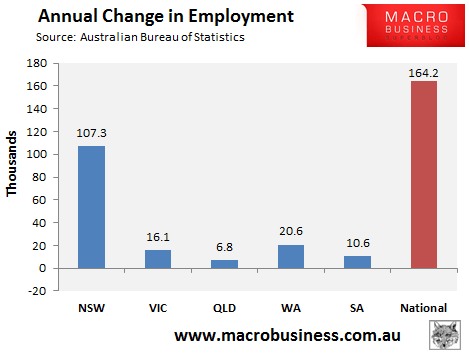
Australia’s employment market is no longer being driven by the mining states, with New South Wales now leading jobs growth over the past year:
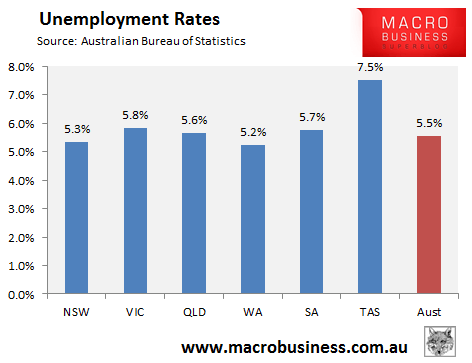
The variance of unemployment rates across the capitals continues to narrow, with the exception of Tasmania, also suggesting the labour market is re-balancing away from mining:
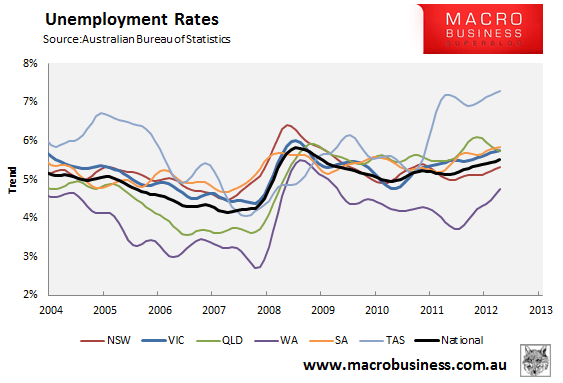
That said, the state seasonally-adjusted figures are notoriously volatile and subject to a big margin of error. As such, the below chart shows the ABS’ trend unemployment rates, which shows Western Australia and New South Wales with the lowest unemployment (but Western Australia’s worsening fast), Tasmania with the highest (and getting worse), and the others close together above the national average:
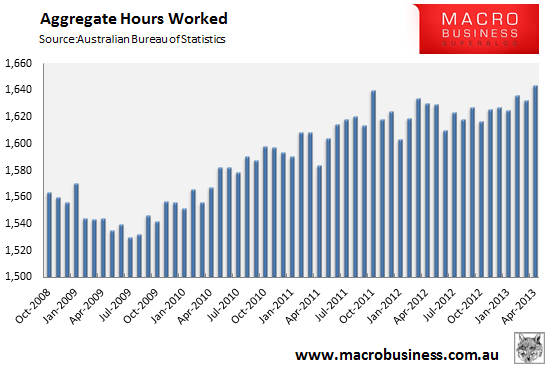
Another positive from this release is that the aggregate number of hours worked rose by 0.7% nationally in April and is now just above the October 2011 peak:
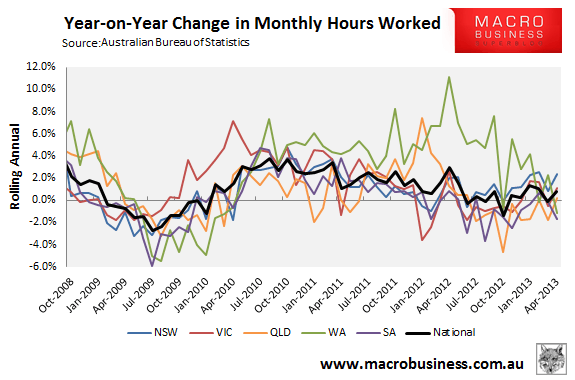
Annual growth in the aggregate number of hours also rose in March – to 0.8% from -0.1% – driven by big gains in New South Wales, Victoria, and Queensland, which offset big falls in Western Australia and South Australia:
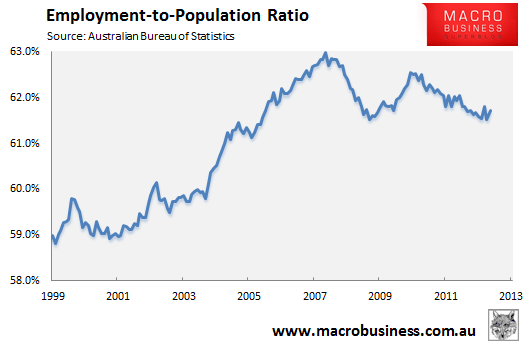
The employment-to-population ratio also rose over the month, but reamins in a downtrend:
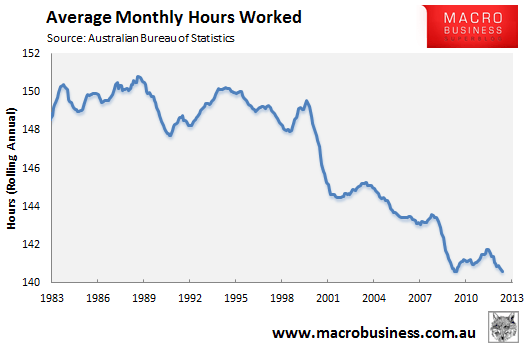
However, the rolling annual average number of hours worked per employed person fell by -0.1 hours to 140.6 hours per month, which is a record low:
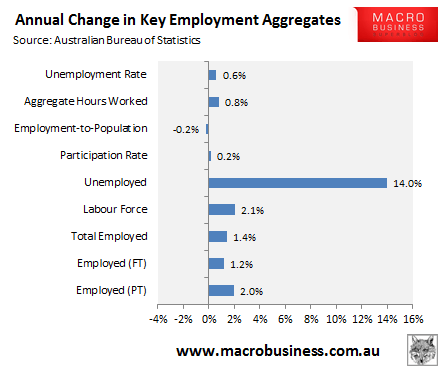
Finally, the below chart summarises the annual change in the key employment aggregates:
Overall, this is a solid release showing ongoing moderate jobs growth and progress in rebalancing away from mining-led employment.
