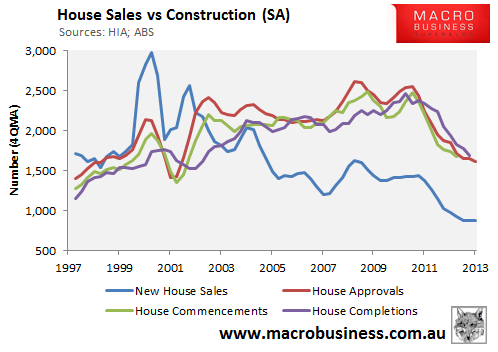
The release of new home sales and approvals data for March has enabled me to compare the quarterly data on new house sales, as provided by the Housing Industry Association (HIA), against house approvals, house commencements, and house completions data, as provided by the Australian Bureau of Statistics (ABS), in order to determine whether Australia is likely to have developed a glut of unsold new houses.
The next chart compares this data at the mainland state level – ie. the sum of New South Wales, Victoria, Queensland, Western Australia, and South Australia. As you can see, new house sales appear to have fallen much more quickly than approvals, commencements and completions since mid-2010, suggesting that a glut of unsold new houses may have developed across the mainland.
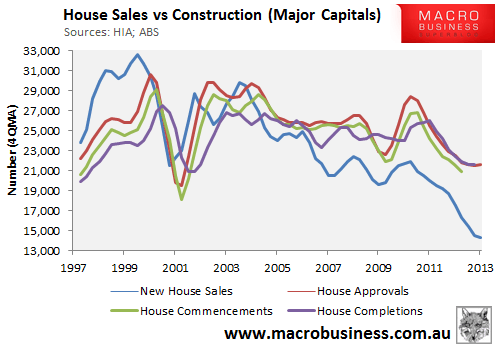
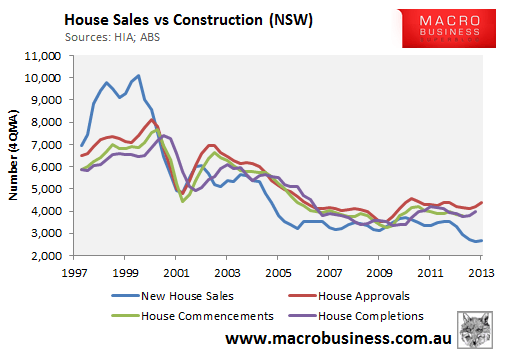
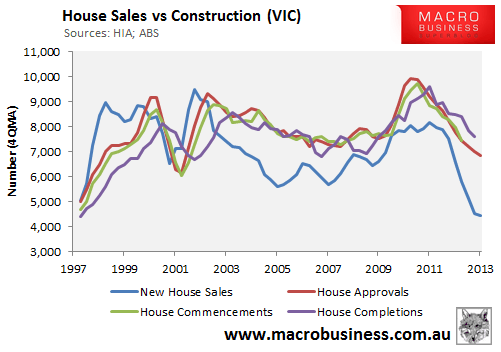
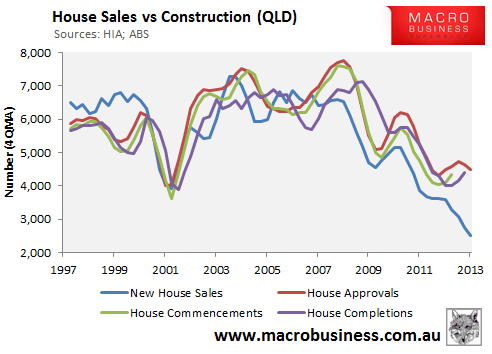
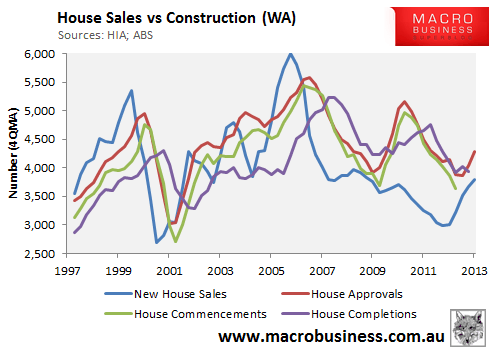
Charts for each of the mainland states are provided below. As you can see, there are large variations between the states, with the stock of unsold new houses appearing to be highest in Victoria, Queensland, and South Australia. By comparison, New South Wales looks to have experienced a smaller increase in the stock of unsold new houses, whereas Western Australia looks like developing a shortage.