Three new reports this morning on property prices and their effects to examine. First up, Westpac has released its quarterly property expectations index:
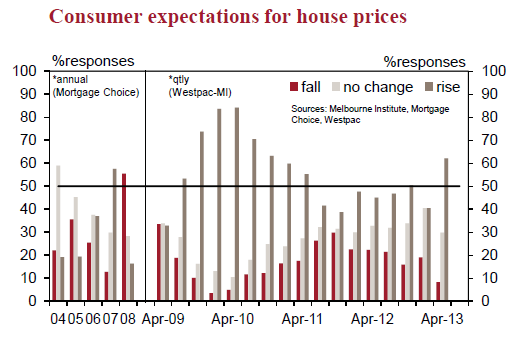
The Westpac-Melbourne Institute Consumer House Price Expectations Index rose sharply in Apr, to the highest level since Jul 2010. The Index, which is the net % of those expecting prices to rise and those expecting prices to fall, rose from +26.7 in Jan to +53.9 in Apr. This is a substantial improvement, marking a breakout from the ‘moderately positive’ range the Index had been stuck in since Jan 2012. After an extended period of uncertainty, Australian consumers now look to be much more convinced that house prices are on the way up.
…Looking across the detailed categories, the main swing has been from expectations of ‘no change’ or ‘fall 0-10%’ (down 14pts combined) towards ‘rise 0-10%’ (+13pts). At 7.8%, the proportion of consumers expecting double-digit house price gains is still smaller than at the start of 2012. The last time Australia recorded 10%+ house price growth was in 2009-10. At that time well over 20% of consumers expected double-digit gains. Available price measures show annual price growth is currently in the 2-3% range.
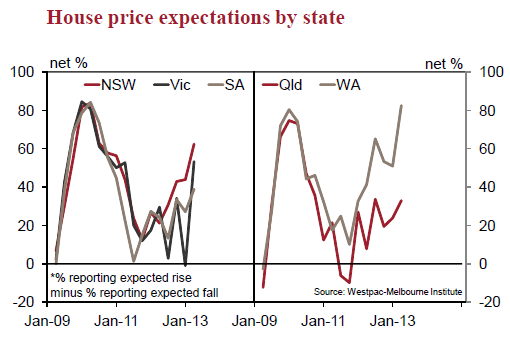
The rises are across all states:
Advertisement
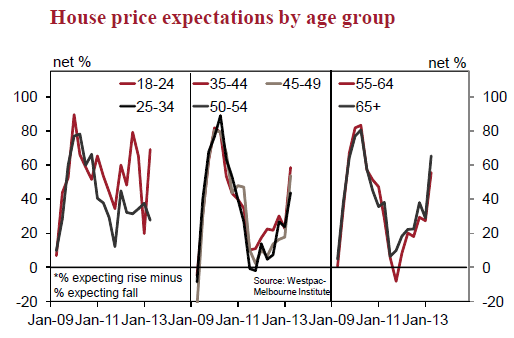
And most age groups, except the one that matters, those on the bottom rung:
Vested interest is a powerful motivator, no? But so long as FHBs sit this cycle out, it will disappoint.
Advertisement
Our next report is from R.P.Data, which has released its new RMI for March:
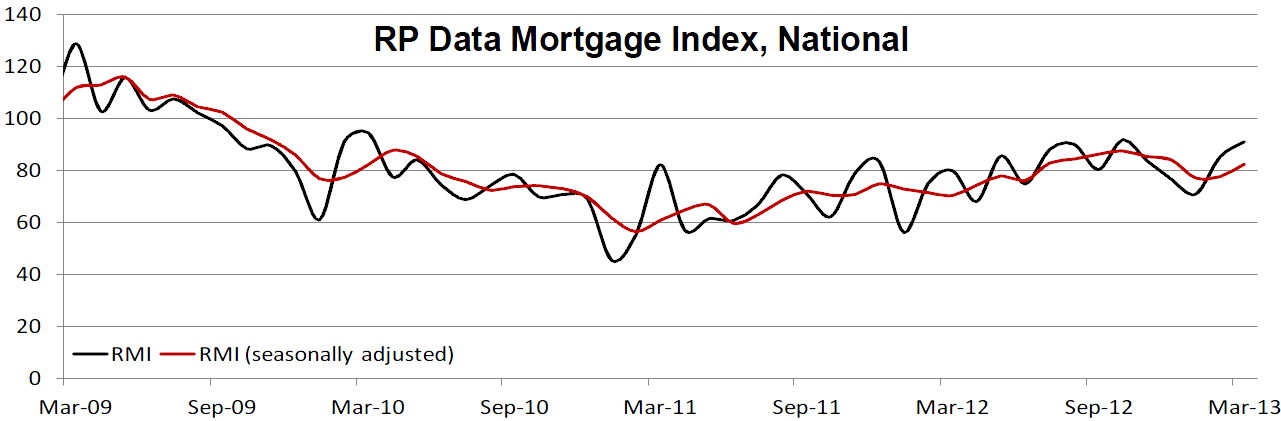
The RP Data Mortgage Index (RMI) tracks metadata flowing across RP Data’s four main finance industry platforms, which accounts for more than 90% of the residential mortgage sector. The RMI was launched in February 2013 and seeks to provide a lead indicator to the Australian Bureau of Statistics (ABS) statistics which are released on a monthly basis. The seasonally adjusted RMI is 88% correlated to the ABS statistics, but is available to the market approximately six weeks sooner.
The National Index reading of 91.1 remains historically high, with the National Index value 6.8 per cent higher than February in raw terms and 6.2 per cent higher in seasonally adjusted terms. This strong national result may be partly indicative of a seasonal lift in mortgage related activity, but also appears to be driven by increased activity from borrowers looking to take advantage of refinancing opportunities with low interest rates and investors also being increasingly active in the market.
So, a good month for the index, but largely driven by refinancing and investors, it seems. This index is brand new and untested so I would treat any conclusions drawn from it with skepticism until it is proven. But the results are consistent with AFG data showing that FHBs are still scarce.
Advertisement
And finally, over to our top property cheer leader, the RBA, which has released a new detailed study into the wondrous effects of property price inflation on household spending. What it finds is fascinating, especially in the context of the present inflation which largely excludes FHBs:
We use a household-level dataset, the HILDA Survey, to explore the relationship between home prices and household spending in Australia. Three main arguments have been put forward in the literature to explain the apparent co-movement between home prices and spending: (1) a ‘traditional wealth effect’, whereby spending rises with home prices due to an increase in households’ lifetime resources; (2) the removal of credit constraints, whereby spending rises with home prices due to households’ ability to borrow more, given more valuable collateral, and the related buffer-stock savings argument, whereby higher home prices act as a form of precautionary savings for low-saving households, allowing them to increase spending; and (3) that spending and home prices move together due to a common third factor, such as changing perceptions of lifetime income.
Our analysis most strongly supports the second explanation – that credit constraints and/or buffer-stock saving are the vehicle through which home prices affect spending. At both the cohort and household level we find that the spending by younger (and so more credit constrained) households is more responsive to changes in home prices than that of older households. This argues against the traditional wealth effect hypothesis; this wealth effect should be stronger for older households who typically own more housing than they will need over their remaining lifetimes. We also find that young and middle-aged homeowners respond more than young renters to rising home prices. This argues against the explanation of a common third factor, since renters and homeowners should both be affected by non-home-price shocks, for example increased income expectations.
So, in conclusion, today’s batch of reports rather suggests that young folks are sitting this property cycle out so far and that that will weigh rather heavily on both price appreciation and the economic benefits flowing from the increased spending that comes with it.
Advertisement
It’s one weird property cycle that’s a brewin’. All reports below.
David Llewellyn-Smith is Chief Strategist at the MB Fund and MB Super. David is the founding publisher and editor of MacroBusiness and was the founding publisher and global economy editor of The Diplomat, the Asia Pacific's leading geo-politics and economics portal.
He is also a former gold trader and economic commentator at The Sydney Morning Herald, The Age, the ABC and Business Spectator. He is the co-author of The Great Crash of 2008 with Ross Garnaut and was the editor of the second Garnaut Climate Change Review.