

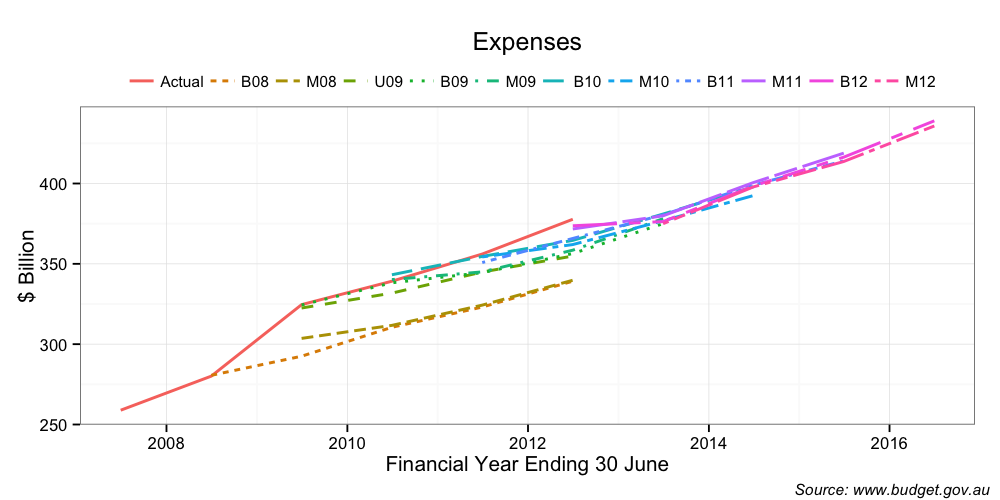
As MB has been arguing for two years, the Budget forecasts put forth by Treasury have been on the happy side. While it was tradition under the Howard government to over-estimate costs and under-estimate revenues, that has reversed under the Labor Government. The following neat charts from Mark the Graph make the point clearly. For each year, the red line is the actual result. On costs it’s under-estimate:

It is intriguing to speculate on where the shift in bias has come from. I wouldn’t necessarily credit former Treasurer, Peter Costello, with the nouse to routinely manage assumptions through making it clear he wanted conservative forecasts. After all, most folks were shocked by the extent of the pre-GFC commodity price boom and its tax collection bonanza.
Likewise, since the GFC, Treasury’s initial rosy forecasts arose from the failure to foresee the slowdown in property, the share market and consumption, which resulted in lower GST and capital gains revenues and higher spending. Given most equilibrium forecasting models rely on simply continuing a trend-line, it is quite possible to see Treasury missing the kind of paradigm shift we have seen since 2010, without blaming political influence.
But there is no doubt, that for the past year, Treasury and the Government have produced the world’s most bullish forecasts for Chinese growth and the prices of commodities. As such, this year’s misses derived almost entirely from the unanticipated correction in the terms of trade. And as this year has also been marked by the absence of any coherent economic narrative from the Government beyond the endless refrain that we should cheer up, it is quite possible that Treasury took that message more literally than the rest of us.
This is all pretty loose stuff. What we do know is that the misses have been of the order of $20 billion per annum or some 6% of the underlying balance in the Budget. That in itself is not disastrous. The resulting cuts and tucks to spending have been bearable enough, even if a pattern of failed optimism is emerging.
But, as we’ve reported over the past few days, Treasury’s happy grin is starting to stretch into a painful grimace. And the AFR very rightly picks up the MB theme today with a look at the assumptions under-pinning the MYEFO. Using forecasts by the consultancy Macroeconomics, the paper offers the following comparisons:

For context, here are a few points for you to consider. The major divergent assumption is the terms of trade. Treasury sees a still gentlemanly decline of 14.75% over four years. ME, rather, a more dramatic fall of 24.5%, front-end loaded.
That may not sound like much but think of it terms of bulk commodities, the obvious place to look for the terms of trade falls, given they make up half of it. All things being equal, Treasury’s 13/14 10.75% fall in the ToT is equivalent to an average iron ore price of around $100.
So, even on Treasury assumptions, the mining boom is busted, which makes its GDP forecasts very happy indeed, not mention extraordinarily reliant upon housing to pick up the slack. As The Pascometer pointed out nicely yesterday:
Dwelling investment is forecast to be flat in 2012-13, before growing 4 per cent in 2013-14. Dwelling investment declined 3.3 per cent in 2011-12 on the back of continued weakness in the detached housing market. Conditions across the sector are expected to improve gradually over the remainder of 2012, consistent with the solid growth in dwelling approvals and commencements seen in the June quarter.
The recovery is expected to gather momentum into 2013-14, driven by a pick-up in home buyer demand, improved affordability following declines in house prices over the past two years and the assumption that interest rates will remain below average across the forecast period.
It had damn well better, because private investment from mining is going to begin falling at the beginning of the 2013/14 year.
On the other hand, in the case of the ME forecasts, if we rely again on iron ore alone, the bigger ToT falls imply a price nearer $70 in 2013/14. Of course, we can’t rely upon iron ore alone to make this judgement of the ME numbers and no doubt they have also embedded some pretty serious price falls in other tradeables. Perhaps especially LNG. But if that’s the case, then there is no way ME’s growth targets are going to be hit either. The kind of ToT fall it is describing will almost certainly result in recession.
For what it’s worth, my own forecasts for iron ore is for a $90 average in 2013/14 and $80 for pretty much every year after that. I also expect LNG prices to fall. So I’m somewhere between ME and Treasury.
The final question, of course, is what are the ratings agency models telling them? The prospect of reaching a surplus across the cycle is looking increasingly remote. We’ve some leeway to run deficits in the next year or so on the global slowdown, but if mine and the ME forecasts come to pass on a structural slowdown in Chinese growth, the AAA rating is going the way of all flesh.
