
The RBA yesterday published the papers and discussions from its conference in August this year on the theme – The Australian Economy in the 2000s. The whole selection of papers makes for an interesting read, including the one clearly written for the benefit our resident troublemaker Houses and Holes, entitled Housing and the Mining Boom.
For me, one paper by Judith Yates entitled Housing in Australian in the 2000s: on the agenda too late?, was particularly useful as it compiled extensive data on a number of Australian housing issues. Unfortunately, the analysis was overly light, occasionally inconsistent, and overlooked critical analysis of comparing yields on residential property and the prevailing interest rate environment in the economy (my analysis of yields and timing the property market is here). This is a critically important factor, because as any homeowner would know, the price of a home not always the nest indicator of the cost of the home, once rates, tax treatment, insurance, ongoing maintenance, and especially mortgage interest rates, are considered.
I have taken a selection of charts from that paper that I believe allows me to weave the best possible story of the Australian housing market.
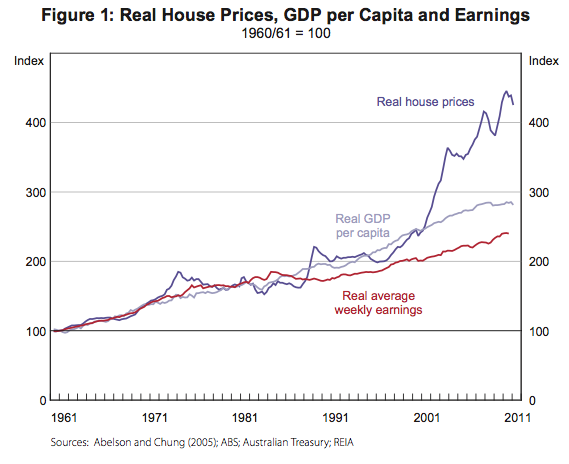
The first chart shows the reason the market is attracting so much concern – real house prices have doubled since the mid 1990s, while real incomes have risen around 25%. To me the divergence of real incomes and real per capita GDP since the early 1980s is also a curiosity.
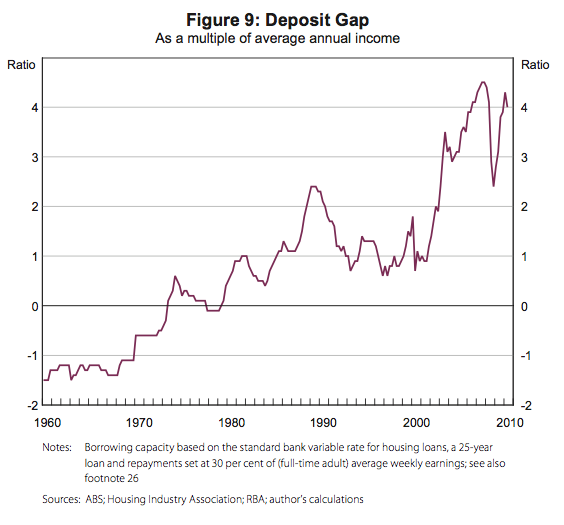
The second chart shows the deposit gap, or the difference between what a household could afford to borrow (based on a 30 per cent repayment to income ratio) and median house prices. This too shot up from the turn of the millennium.
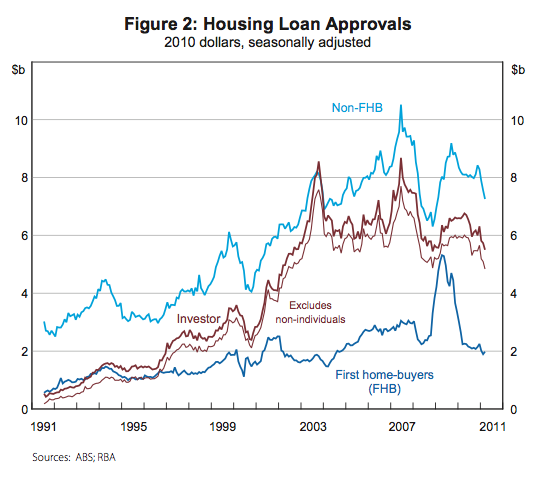
As the deposit gap alludes, borrowing capacity, and credit conditions generally, very much drive the housing market. We can see in the chart below that home loan approvals surged during the early 2000s, particularly for investors. The dominance of investor moves into housing, accepting lower yields, is a key factor in the house price story
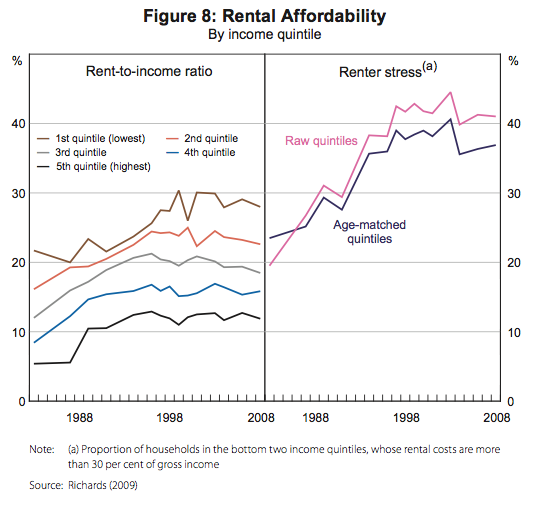
We see below that during the price boom that began in 1998, rental affordability actually improved for households at all income levels. Clearly, the notion of supply constraint influencing the housing market appear a little out of place, unless such constraints can mysteriously avoid the rental market altogether.
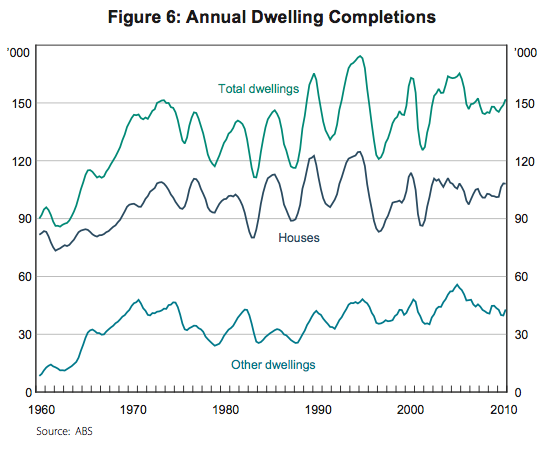
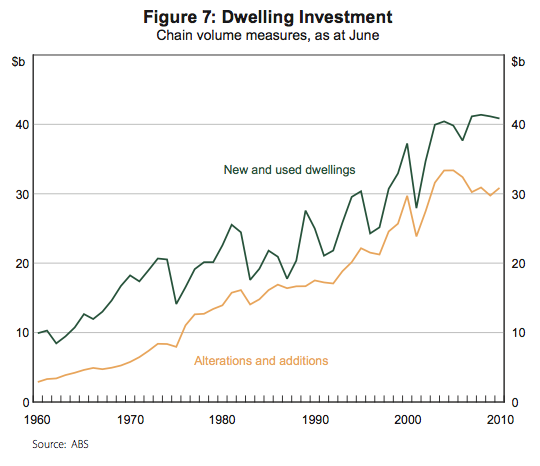
Lastly to appease the concerns of those worried about a chronic housing shortage, or even simply an imminent one, the two charts below should put your mind to rest. The first shows just how responsive (or volatile) housing supply can be. The second shows that investment in alterations and additions, which increases the occupancy capacity of the existing housing stock, has grown tremendously since the early 1990s.
In all, a credit fuelled asset bubble, where expectations of capital gains enabled investors to accept very low yields, and create a feedback loop that results in high actual rates of capital growth.
Tips, suggestions, comments and requests to rumplestatskin@gmail.com + follow me on Twitter @rumplestatskin