
Continuining again our focus on the US S&P500 stock index, today’s chart come from Goldman Sachs (via Zero Hedge):
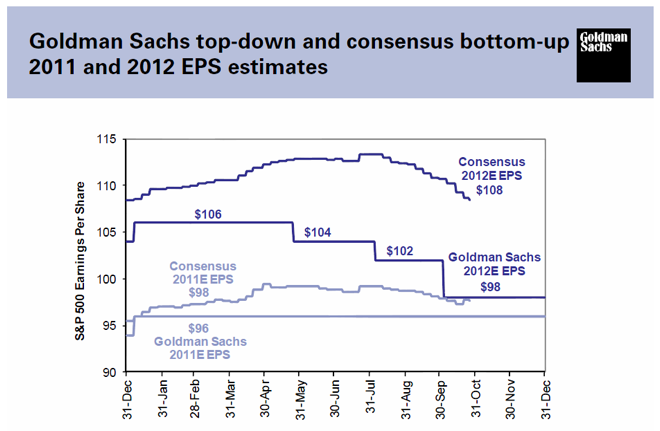
This chart says a 1000 words, but for those not sure what’s going on, its seems the ca. 1.5% cut to US GDP coming next year (courtesy of austerity), has been priced in the consensus forward earnings estimates for FY12. That’s the top line tracking the end of week consensus figures, now back to where they started around this time last year.
Goldman Sachs is more bearish, with next year earnings likely to end up basically the same as this year.
Advertisement