
The S&P/ASX 200 Index closed up 14 points or 0.3% to 4242 points after dropping sharply in the morning session following broad losses on US and Euro markets on Tuesday night. In after hours trading, the index has slipped 20 points, but Euro and US markets are pointing to mixed opens.
Asian markets behaved in kind, with Japan’s Nikkei 225 up 0.3% at 8792 points, the Hang Seng up nearly 0.4% to 19040. The Shanghai Composite stood out again and is currently up 1.1% to 2436 points continuing its bounce off a 2 year low.
In other risk assets, the AUD is currently trading at 103.6 cents USD after digesting today’s anemic core inflation figures, whilst WTI crude rose 0.25% percent to $93.42 USD a barrel.
Gold rose over 1% during the Asian session building on a huge gain overnight, currently at $1717 USD an ounce or $1657 AUD an ounce.
Movers and Shakers
A generally ok day on the board of the ASX, eventually, with the health care sector leading the charge, down 3.2% followed by IT and telecomms, whilst the usual suspects – energy, financials and materials a mixed bag.
The banks were all bid up, with ANZ up 0.2%, Commonwealth (CBA) 0.8%, National Australia Bank (NAB) 1.1% and Westpac (WBC) the best up 1.3%. Macquarie (MQG) was steady to finish above $23 per share.
Cochlear (COH) slumped 0.75%, whilst its “twin” CSL bounced up 2%. Telstra (TLS) put on 0.3% in a holding pattern.
BHP Billiton (BHP) was the only ASX8 loser, down 0.6% whilst Rio Tinto (RIO) was steady, Newcrest Mining (NCM) up 3.5% on a good gold price in AUD, Fortescue (FMG) up 1.5% and Woodside Petroleum (WPL) up 1%.
The Charts
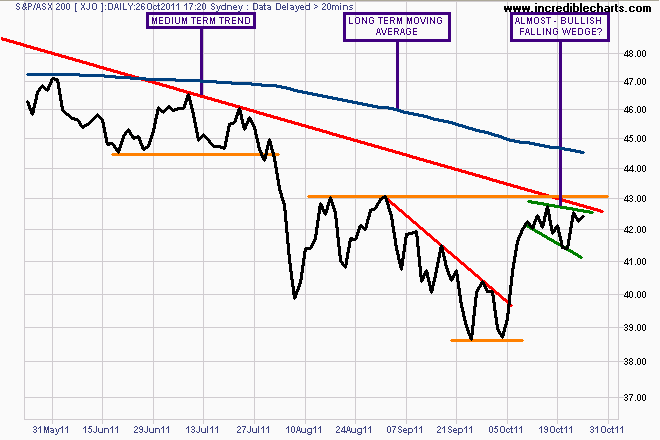
This is like pulling teeth. The daily chart shows a short term falling wedge pattern – a bullish continuation pattern that should see the ASX200 crossover resistance at 4300 points any day now.
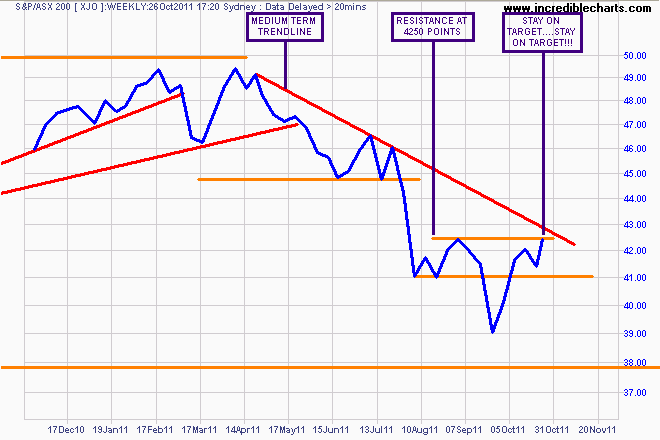
As I have contended since the lows of early October, the market still needs to clear these levels but preferably on a weekly closing basis. A classic inverse head and shoulder’s pattern is forming on the weekly chart, with price about to break above its resistance level at 4250 points.
Daily, I scan just over 100 stocks (after scanning about 30 different futures markets) and the vast majority are clanging bullish signals, some breaking out and others setting up for short to medium term rallies. The US and Euro markets are encountering resistance after breakouts, as shown by Colin Twiggs here:
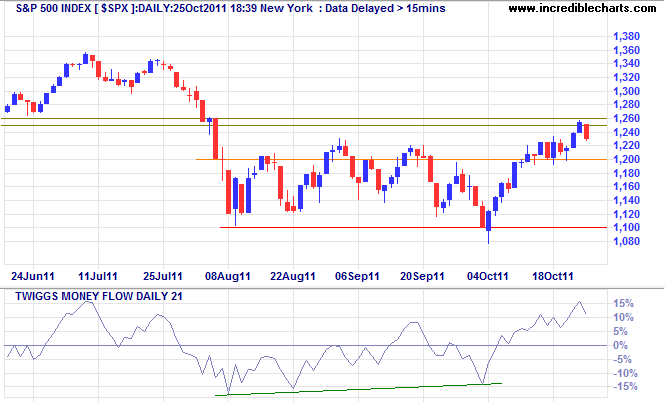
As our markets follow the US and Euro like clockwork, this structure must be cleared for a push above the 4250-4300 resistance level.
Until then, its a waiting game. All eyes on Europe. Stay on target…
Watch my “Chart of the Day” posts for continued analysis of US, Euro and Asian markets.