
The S&P/ASX 200 Index closed down 27 points or 0.6% to 4227 points in a wayward session coming after a positive follow up session on US and Euro markets on Monday night. In after hours trading, the index has slipped slightly, but Euro and US markets are pointing to similar losses.
Asian markets were also sluggish, with Japan’s Nikkei 225 down 0.9% at 8762 points, whilst the Hang Seng was up nearly 0.4% to 18884. The Shanghai Composite bucked the trend and is currently up 1.8% to 2413 points bouncing off its 2 year low.
In other risk assets, the AUD is currently trading at 104.66 cents USD after digesting RBA Governor “Boom Boom” Battelino’s speech, whilst WTI crude rose nearly 0.5% percent to $91.64 USD a barrel.
Gold rose slightly during the Asian session, currently at $1655 USD an ounce or $1582 AUD an ounce.
Movers and Shakers
A red day on the board of the ASX, with the health care sector leading the charge, down 3.2% followed by IT and telecomms, whilst the usual suspects – energy, financials and materials a mixed bag.
The banks were all sold off, with ANZ down 0.74%, Commonwealth (CBA) .12%, National Australia Bank (NAB) 1.1% and Westpac (WBC) losing 0.7%. Macquarie (MQG) also lost about 1% to finish just above $23 per share.
Cochlear (COH) slumped 3%, probably on profit taking after such a quick bounce, whilst its “twin” CSL also lost 3%
BHP Billiton (BHP) stood out, probably on the back of reversing commodity prices, up by 0.8% whilst Rio Tinto (RIO) gained 1.5%, Newcrest Mining (NCM) steady, Fortescue (FMG) down 1.3% and Woodside Petroleum (WPL) off 0.3%.
The Charts
A strange follow up day to the ebullience of yesterday? One day does not make a trend (usually), but today’s chart
shows the market is reluctant to be bid up above resistance at 4300 points – also the conjunction of the medium term downtrend and slightly below the long term moving average.
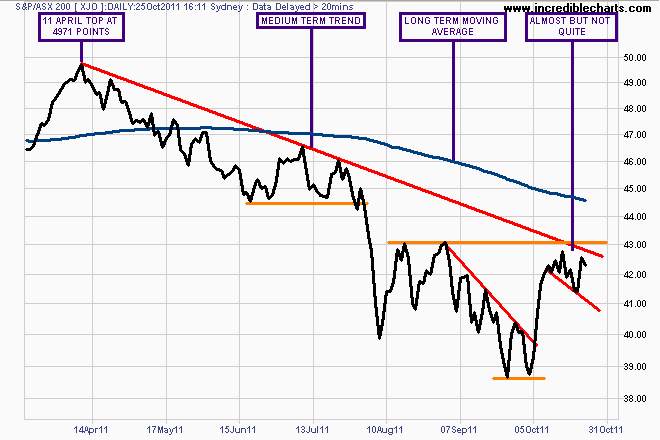
As I have contended since the lows of early October, the market still needs to clear these levels but preferably on a weekly closing basis. Although a classic inverse head and shoulder’s pattern appears to be forming, the weekly price is also refusing to budge above the dominant trendline. (note weekly chart below is very large)
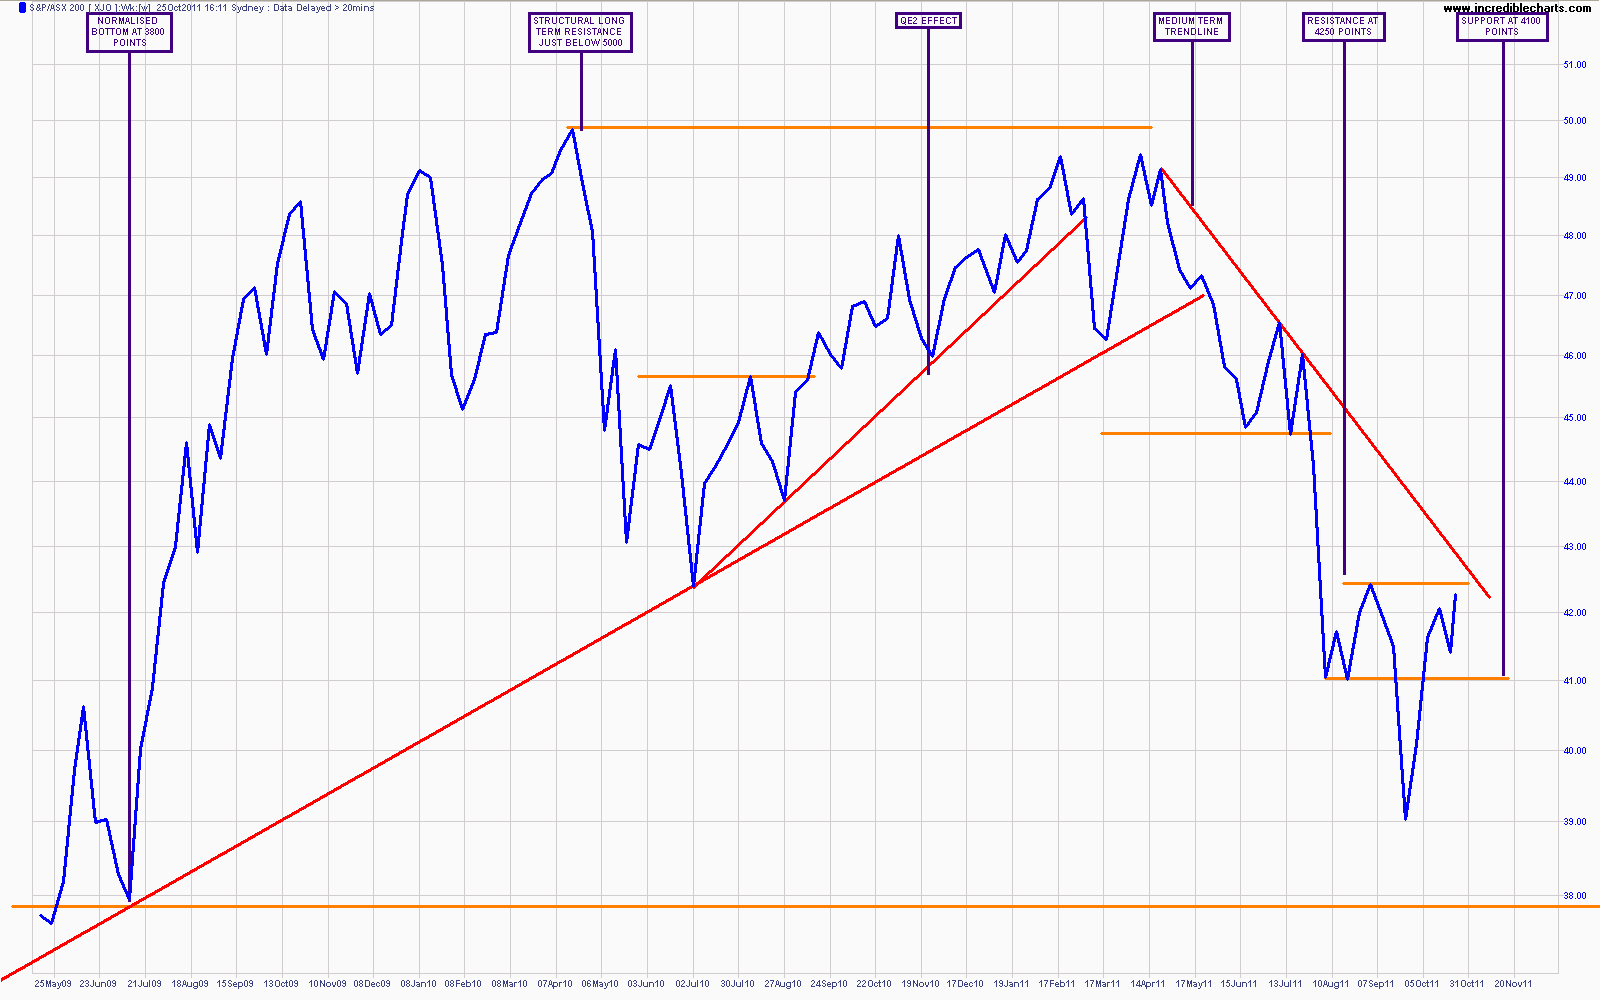
Click to enlarge full size
For this bear market rally to become a new cyclical bull market, the index must close above the long term moving average at approx. 4450 points (probably with a retest of the old resistance as it becomes support, thus completing the pattern).
Watch my “Chart of the Day” posts for continued analysis of US, Euro and Asian markets.