
The S&P/ASX 200 Index closed up 113 points or 2.66% to 4255 points in a very positive session coming after a strong rally on US and Euro markets on Friday night. In after hours trading, the index has slipped slightly, but Euro and US markets are pointing to slightly higher opens.
Asian markets were also bullish, with Japan’s Nikkei 225 up 1.68% at 8824 points, whilst the Hang Seng was up nearly 4% to 18731. Chinese investors finally celebrated a good day on the Shanghai Composite – currently up 1.7% to 2358 points, most likely in reaction to the good PMI figures.
In other risk assets, the AUD is currently trading at 104.06 cents USD whilst WTI crude rose nearly 1 percent to $88.22 USD a barrel.
Gold rose 0.6% during the Asian session, currently at $1644 USD an ounce or $1581 AUD an ounce.
Movers and Shakers
Unicorns and rainbows on the ASX, with the usual suspects outperforming – energy and materials up 3.6% with financials up 2.6%
The banks were all good, with ANZ up 2.33%, Commonwealth (CBA) 2.6%, with National Australia Bank (NAB) up 2.5% and Westpac (WBC) the winner up 3%. Macquarie (MQG) also put on 3.6%
Cochlear (COH) jumped nearly 4% to close above $60 per share whilst its “twin” CSL put on 0.33%
BHP Billiton (BHP) was bid up strongly by 3.2% whilst Rio Tinto (RIO) gained nearly 5%, Newcrest Mining (NCM) losing 0.1%, Fortescue (FMG) up 8.4% and Woodside Petroleum (WPL) up 3.6%.
The Charts
On Friday, I suggested that “no one wants to hold risk assets going into the EU Meeting/Conference “talkfest” this weekend”. Lack of bad news and speculation caused Euro and US markets to jump on Friday night (which is why I don’t complete my weekly analysis until Saturday morning) which has led to some frantic buying this morning and then again later on today.
Today’s chart – please forgive the array of lines – shows that the index is back to last Monday’s level (but not yet above) and that the recent two weeks of activity are above the medium term moving average, which coincides with support at 4100 points. Importantly, the medium term trendline is about to be breached.
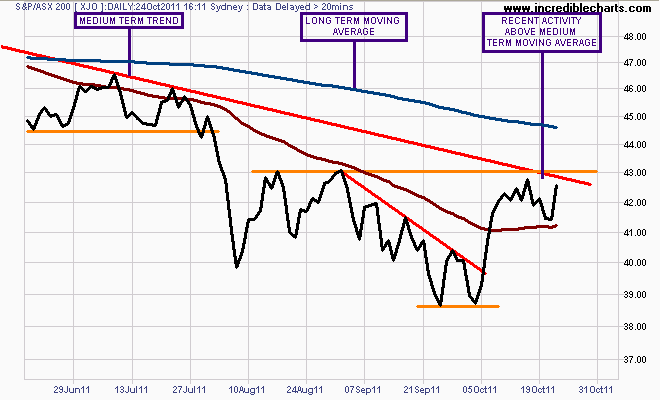
As I have contended since the lows of early October, the market still needs to clear the resistance level at 4300 points and the medium downtrend line (marked in red) but preferably on a weekly closing basis (even though resistance is technically only at 4250 points). For medium to long term investors, you should be watching weekly, not daily charts for this very reason.
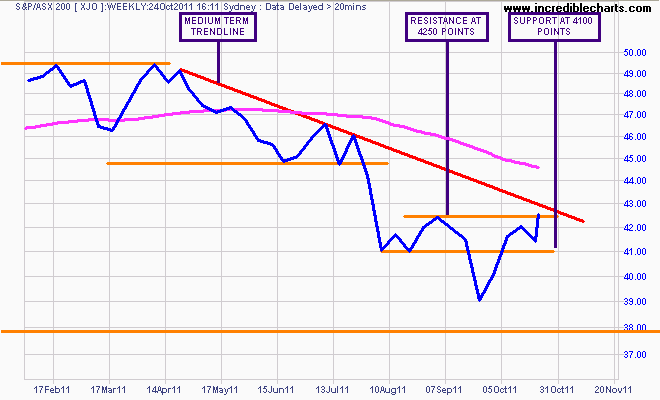
For this bear market rally to become a new cyclical bull market, the index must close above the long term moving average at approx. 4450 points (probably with a retest of the old resistance as it becomes support, thus completing the pattern).
Watch my “Chart of the Day” posts for continued analysis of US, Euro and Asian markets.