
The S&P/ASX 200 Index closed up 27 points or 0.64% today to 4213 points following the rumor-led rise from overnight US and Euro markets. In after hours trading, the index is steady, with Euro and US markets pointing to modest opens.
Asian markets experienced similar moves, with Japan’s Nikkei 225 up 0.35% at 8772 points, whilst the Hang Seng leapt 1.7% to 18385.
In other risk assets, the AUD is currently trading at 103.11 cents USD whilst WTI crude rose slightly to $88.56 USD a barrel.
Gold rose half a percent during the Asian session, currently at $1660 USD an ounce or $1606 AUD an ounce.
Movers and Shakers
A mixed board on the ASX, with all sectors but materials up for the day, IT standing out putting on nearly 2%
All of the banks were bid up slightly, with ANZ up 1.1%, Commonwealth (CBA) 1.18%, National Australia Bank (NAB) up 1.5% and WBC up 1.25%. Macquarie (MQG) was sold off and lost 1.65% for the day.
Cochlear (COH) gained over 5.4% after to finish above $56 a share. CSL put on 1% on the back of a $900 million buyback plan announcement closing the day above $30 a share.
BHP Billiton (BHP) finished flat after rising in the morning probably due to concern about the drop in iron ore, whilst Rio Tinto (RIO) lost just over 1.7%, Newcrest Mining (NCM) lost over 2.3%, Fortescue (FMG) down nearly 3% and Woodside Petroleum (WPL) up slightly, putting on a quarter of a percent.
BHP warrants a closer look, as this ASX8 member effectively drives the index. First, the daily chart shows a bearish megaphone pattern (characterized by higher highs and lower lows as the bulls and bears battle it out), with short term support at $36.50 level. A break of this level sees the initial downtrend target to the double bottom support at $34.
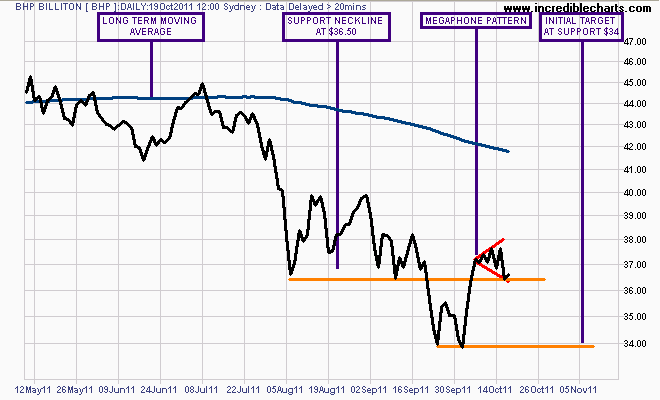
Daily chart of BHP - note how close this is to the index daily chart at end of post
If BHP closes the week above $36.50 this means the megaphone pattern has failed and price is more likely to continue sideways or up.
However, the weekly chart over shows that BHP remains in a steep downtrend channel, from the megaphone topping pattern in May. This weekly price action does not correspond with the rising support levels shown during the May to October period of 2010 and remains in a downtrend.
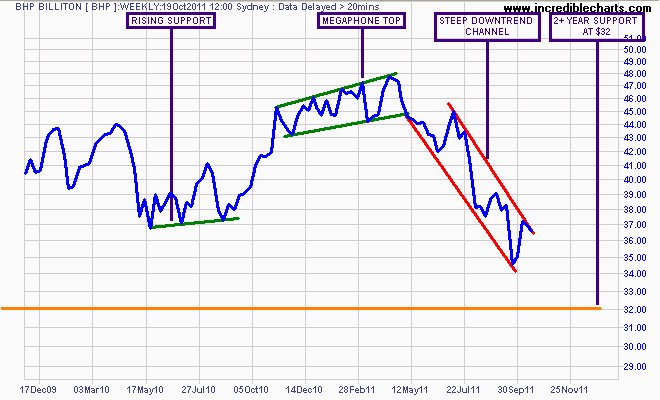
Weekly chart of BHP - note the weak support compared to August 2010
The intermediate target is the 2+ plus year support level at $32, with terminal target at $27 per share, the GFC low.
The Charts
Another strange day in the undollar snapback rally. As I said yesterday, “the market has – for now – rejected resistance at 4300 points (the intraday high on Monday was 4287)” and is only moving on rumour and innuendo emanating from Europe.
Today’s chart is eerily similar to BHP (no surprise given the concentration of BHP in the ASX200), and in the very short term is forming (in my view) an unreliable, but bearish megaphone pattern.
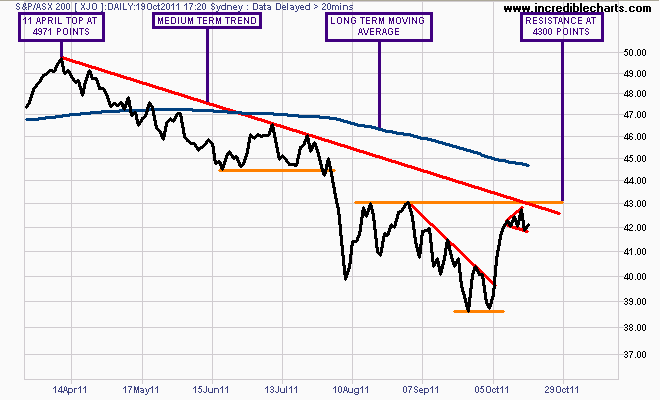
As I keep saying, a continued rally needs to surpass the 4300 level, preferably on a weekly basis, and then closing above the long term moving average. Until then, this remains a snapback short covering rally as part of a medium term downtrend.
Watch my “Chart of the Day” posts for continued analysis of US, Euro and Asian markets.