
Today’s chart will be very simple and illustrates what is happening on risk markets around the world.
Its an index I’ve followed previously, the CRB Index – which measures a basket of 19 commodities, split amongst the energy, base metals, agricultural etc.
And what is the chart saying? Rollover and stay down.
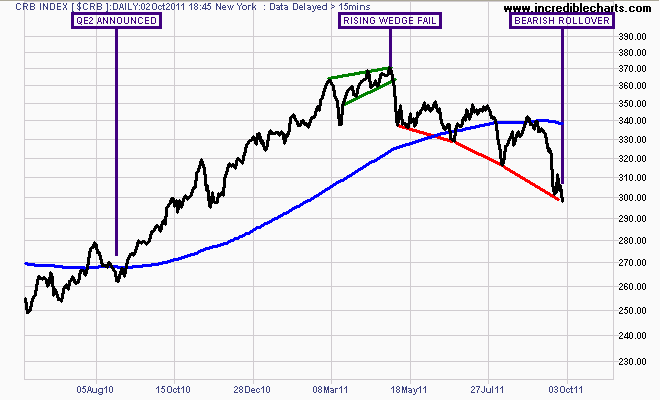
The QE effect on exchange traded commodity prices is unwinding faster, as the series of successive lows is accelerating (note gradient of red trend lines under price).
Therefore, if no further stimulus is forthcoming, the target is at or below the price before QE2 in August 2010. If the de-financialisation of commodities continues, the next target is the March 2009 lows, around the 200 level.
Update (h/t Briefly):
Here is the CRB Index plotted against the US Dollar Index (not inverted):
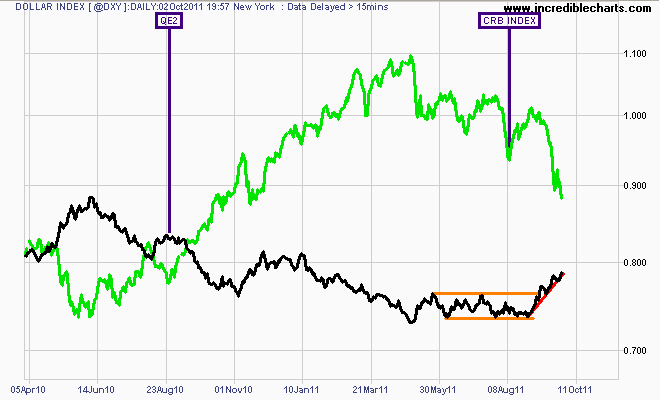
US Dollar Index (black) vs CRB Commodity Index (green) over 18 months