
The S&P/ASX 200 Index closed down 1.6% or 67 points today to 4005, after a solid up-session in the morning, when the one-two punch of lower inflation and Moody’s downgrade of French banks tipped the bourse into the red. In after hours trading, the market is steady whilst the Euro and US futures point to similar losses. The Great Volatility continues…
Asian markets experienced similar moves, with the Nikkei 225 down 1.14% to 8518 points, whilst the Hang Seng, reopening after a public holiday yesterday, fell 1.4% to 18757 points.
In other risk assets, the AUD lost over 1% (probably due to the final bullhawk shot off his perch realising that rates aren’t going to rise anytime soon) and is holding on to just above 1.02, whilst WTI crude fell almost 2% to $88.55 USD per barrel.
Gold followed the rise of the ASX200 (and all other risks assets) and was bid up in the morning Asian session after hitting the $1800 low again, and is slipping in the pre-London trade, now at $1820 USD an ounce. It seems that $1800 is an agreed support level for now.
Movers and Shakers
A red day across the board on the ASX, with all sectors sold off, except Telco stocks as Telstra (TLS) was bid up on rumors of a probable buy back later this year or early 2012, but without franking credits. Healthcare was the biggest loser, driven by large losses in Cochlear (COH) again, which fell almost 15% from yesterday’s brief rally. Volatility is opportunity, although this is misunderstood by most…
The banks were all sold off at least 2 percent or more, with ANZ down 1.5%, CBA down 2.5%, NAB down almost 3% and WBC just over 2%. Macquarie (MQG) lost almost 4% and is now just above $21 – at GFC levels.
BHP Billiton (BHP) outperformed, dropping only 1% alongside RIO which only lost 0.8%
The Charts
The daily chart below illustrates the concepts of support and resistance well. The lower band in the “W” shaped price channel from mid August to last week, at 4100 points was support.
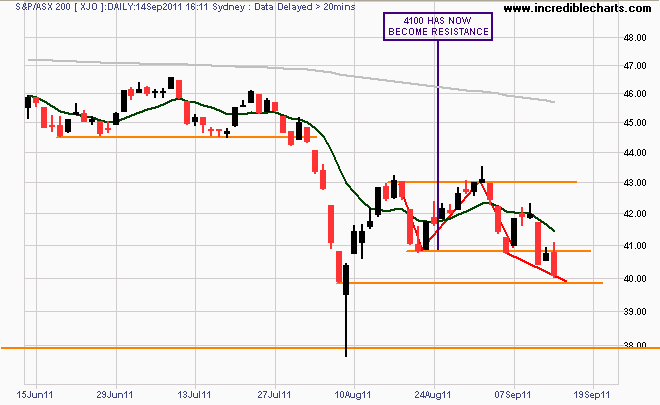
However, the polarity has now changed and has you can see by the long tails on yesterday and today’s daily candles, whenever the index is bid up to the round number, it is sold off heavily. Resistance is futile for now.
The short term trend is down towards the historic closing low just below the very psychologically powerful 4000 point level. The next target thereafter remains 3800 points.
The weekly chart reinforces this thesis – the strong support of the last month and a half after the failure of support at 4500 points in late July, has now become resistance. If the market fails to close the week above 4100 points, the likely path is that shown on the chart (red lines) with a probable bounce off 3800.
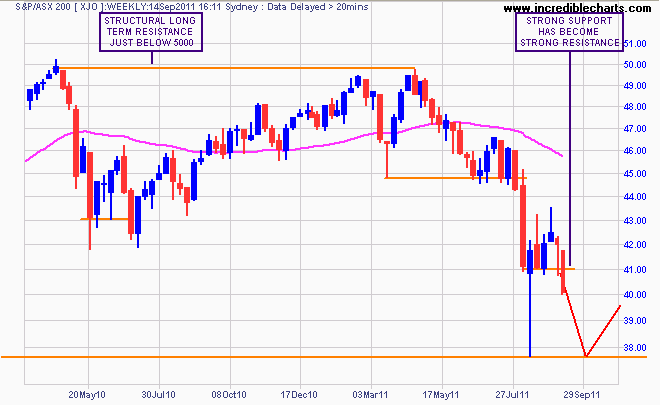
Weekly chart of ASX200
As I said yesterday, bullish investors (is there any other type?) should keep these levels in mind and the fact that all chart patterns are continuation – i.e they are confirming a continued downtrend.