
With last night’s announcement by the Federal Reserve of Operation “Twist”, instead of milky wilkies (a proper QE3), the US dollar is now on a tear. Up.
The US Dollar Index is something I’ve followed and mentioned in “Chart of the Day” posts and equity/risk market analysis for some time now. In my 7th September post, I picked the possible start of the USD rally and in my 9th September post, I confirmed such a rally with a breakdown in the Euro.
On both occasions I expanded on the US dollar rally/collapse thesis, so it bear’s (sic) repeating what it’s all about.
The US Dollar index is a weighted basket of foreign currencies (not including the Aussie). The weightings are:
- Euro (EUR), 58.6% weight
- Japanese Yen (JPY) 12.6% weight
- Pound sterling (GBP), 11.9% weight
- Canadian dollar (CAD), 9.1% weight
- Swedish krona (SEK), 4.2% weight and
- Swiss franc (CHF) 3.6% weight
Now, given that the Euro is weakening on the back of a rolling succession of crises, the Swiss Franc has been purposely weakened against the Euro by the Swiss Central Bank by unlimited QE, the UK pound is weakening due to higher inflation, and the Yen is strengthening as it continues its 2 decade long debt deflationary spiral and Helicopter Ben is just moving money around instead of dropping it into eager commodity trader’s laps – where is the US dollar to go?
Here’s the latest short term chart showing the breakout and subsequent trend, confirmed by the “twist” at the Fed:
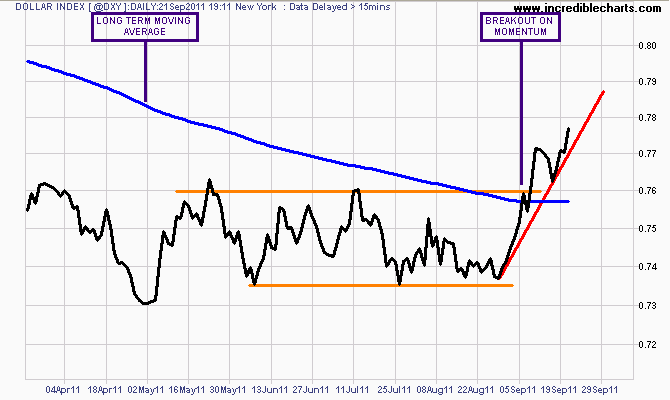
Daily 6 month chart of the US Dollar Index - note the orange lines showing a rectangle base pattern.
Here’s the medium term, weekly chart, showing a probable trajectory:
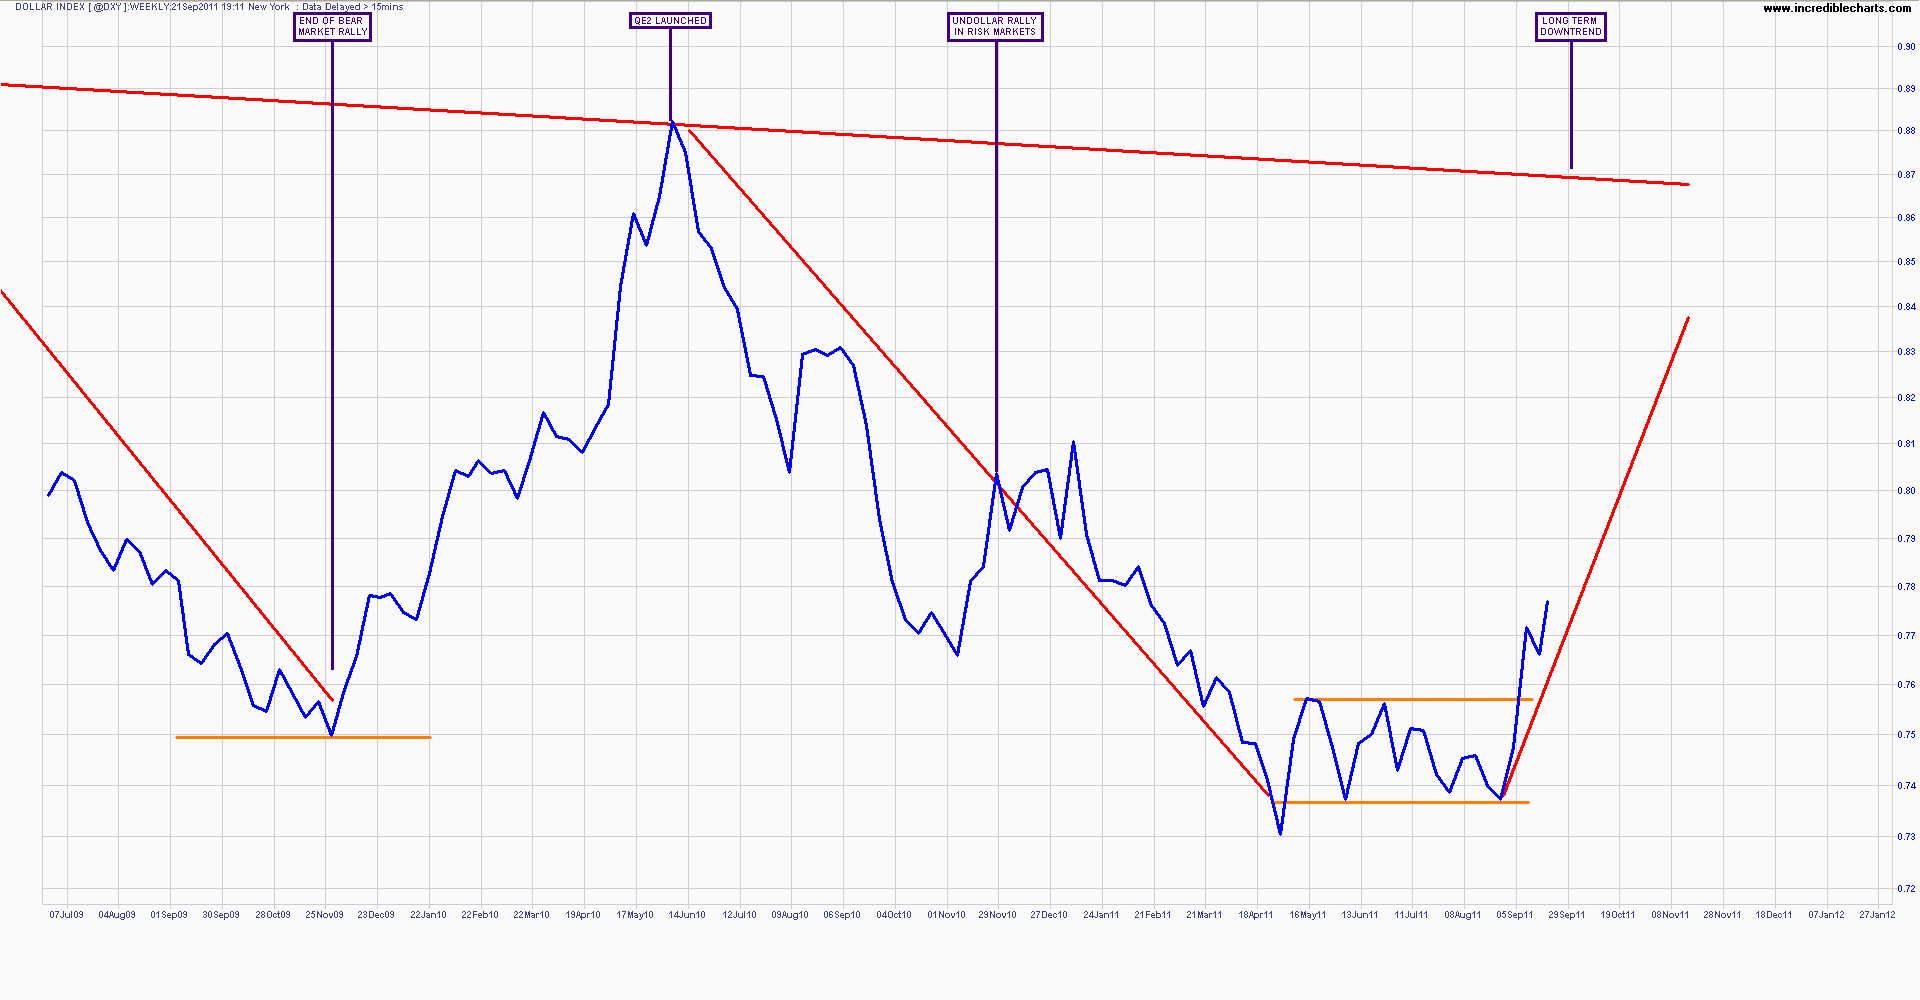
Weekly chart - note 2010 QE2 undollar rally - click to enlarge full size
And finally, here’s the main study I’ve been using – a longer term chart of the waves and cycles within the US Dollar Index as risk has moved from US dollars to “un-dollars” – or stocks, commodities, non-USD currencies.
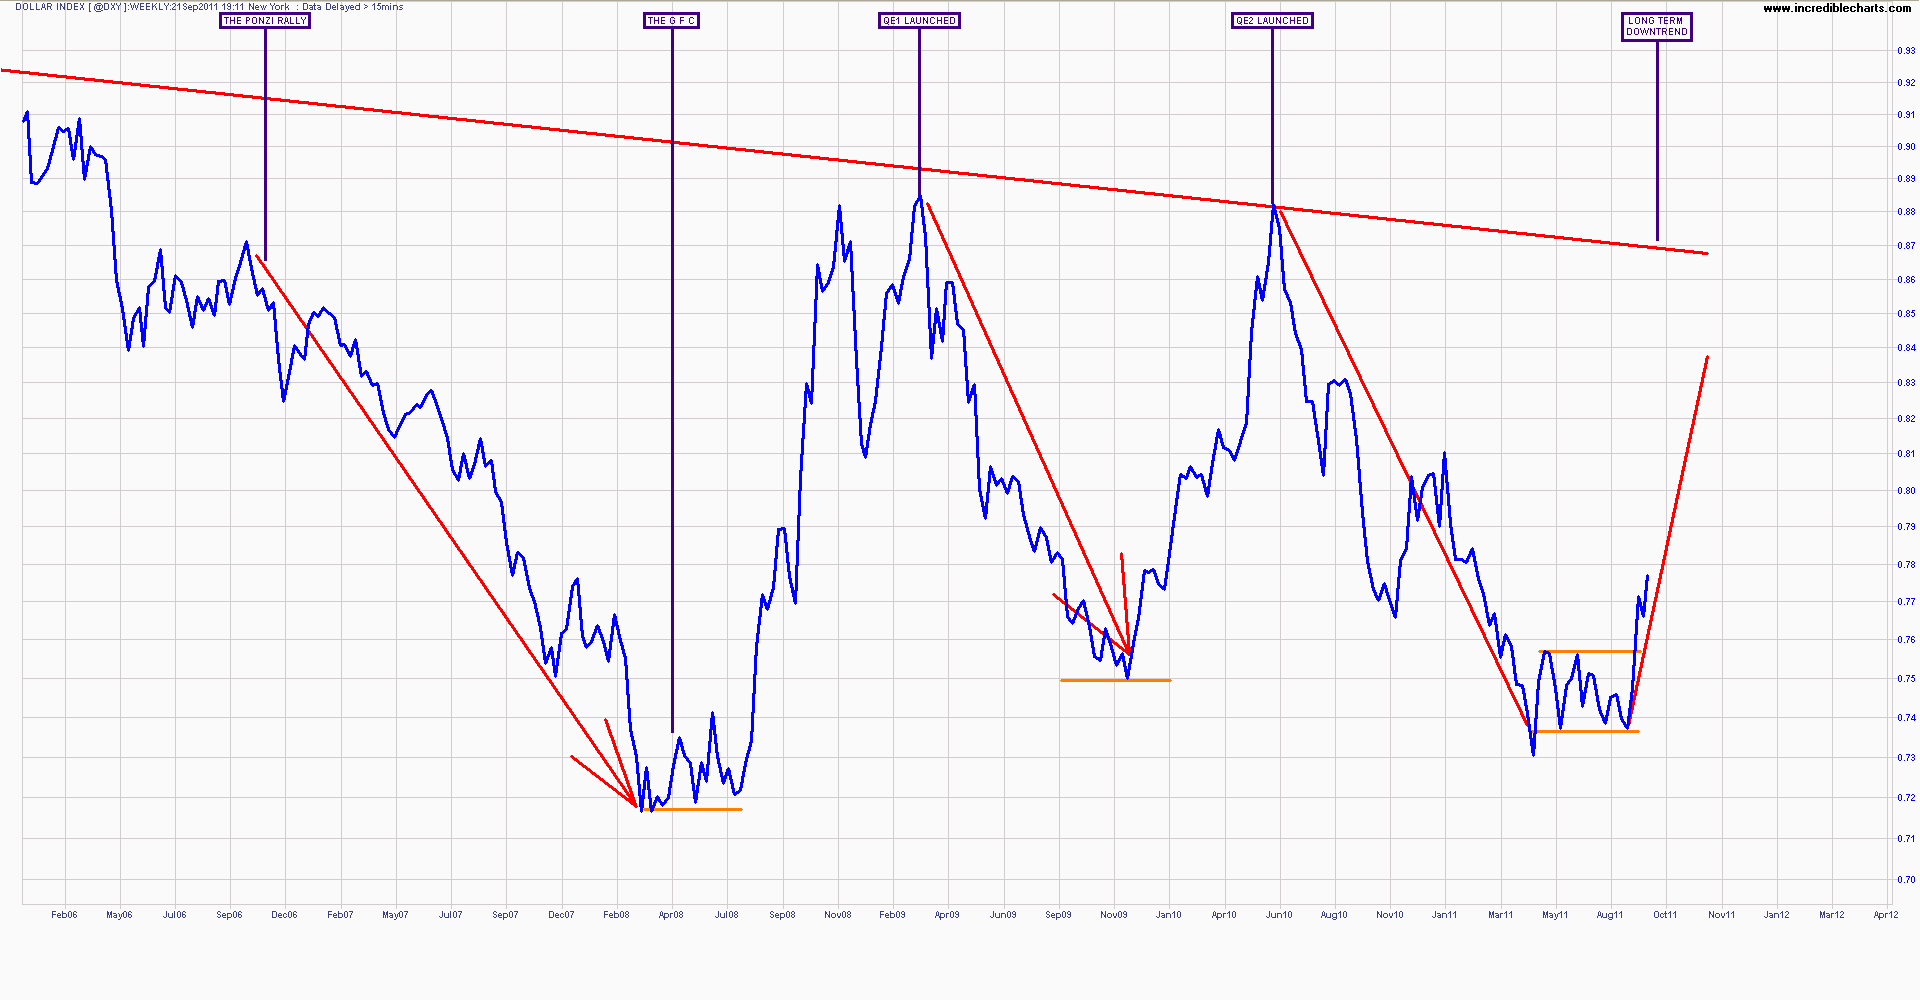
Weekly chart - the full catastrophe - risk on, risk off, risk on, risk off....
When crisis of confidence hits, the risk money moves to USD (including T-notes and T-bills). When expectation of increased risk asset valuation lifts higher, this self-fulfilled prophecy means risk money moves out of USD (and bonds).
What does this mean for Australian risk assets – the AUD and the ASX200? Considering that the world risk market treats Australia as a derivative of China, and hence a commodity “play”, and regardless of economic strength or vitality, developed world markets move in lockstep, the risks are high.
Deus Forex Machina has explained the possible trajectory of the AUD this morning, and I have contended that the ASX200 is in a secular bear market with possible best case analogs to the 1987-1996 and 2001-2003 cyclical bear markets.
This morning’s futures point to a sub-4000 opening for the index and another leg down to 3800 is highly probable. The next target is 3100 points – if reached we can be almost assured that the printing presses will start up again and it will be another undollar rally.