
Today’s chart is from Zero Hedge (h/t Bullion Baron), showing how New York Stock Exchange (NYSE) short interest has returned to July 2009 highs (black bars) vs the S&P 500 (red line), the broadest US stock market measure.
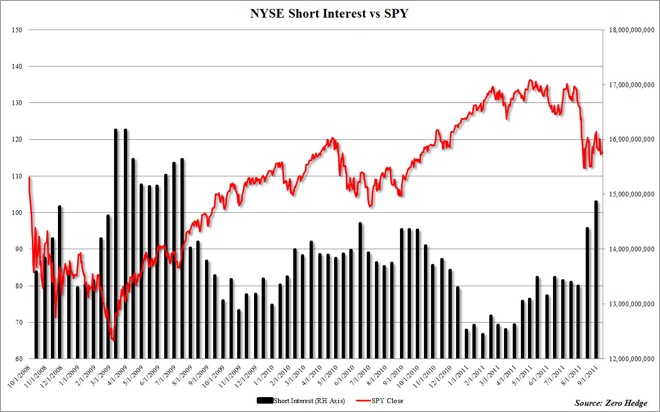
What is short interest? It’s a measure of the number of shares that have been borrowed (the “interest”) and subsequently sold (the “short”), in expectation of further price falls. Like margin lending measures, it creates extra pressure by increasing the flow of money into the market – this time on the downside during a correction – but can also have a violent affect on the upside when the short sellers need to “cover” their interest, and buy back all that stock.
After last night’s reversal rally in Europe and the US, although relatively weak, coming into the US Federal Reserves meeting on September 21, there is an extended probability that the abundance of shorts may need to be covered.