
Given the events of last night (German DAX down 5.3%, UK FTSE down 3.5%, Italian MIB down 4.8%), today’s chart will be an overview of equity markets and their short term patterns.
Let’s start in Europe:
The Italian (remember, 7th largest economy in the world, sometimes forgotten) FTSE MIB Index is about to retrace the GFC low in a 2.5 year half circle pattern. The Italians love their botox too.
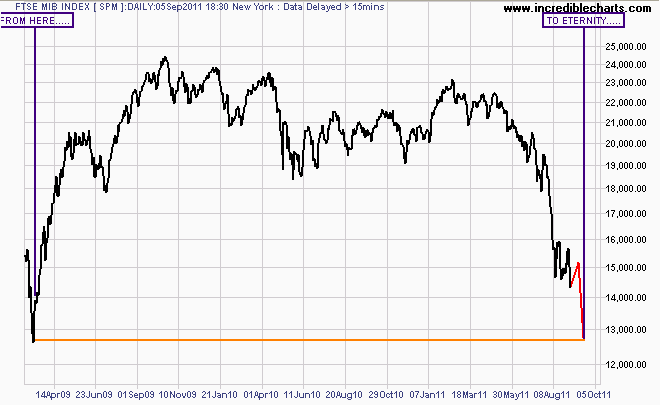
FTSE MIB Italian Index from early 2009
The UK FTSE has set up a bear flag pattern, with a break below 5100 points starting a new downtrend.
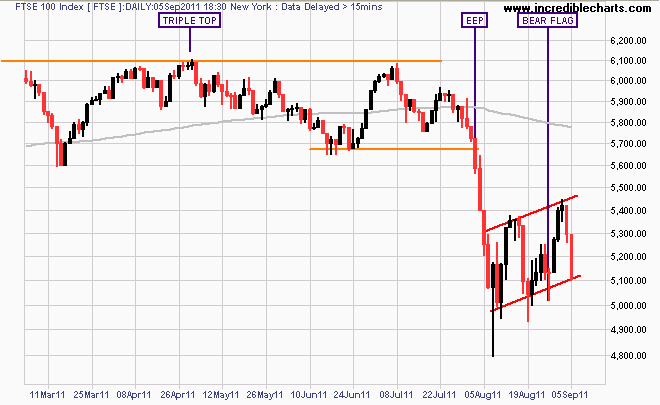
FTSE100 Index - Bear Flag Pattern
Technically, the German DAX Index, having crashed over 30% so far, is in a bull flag pattern, however this is almost always invalid during a downtrend and is likely a continuing price channel. Since short selling is prohibited, there will be no shorts to cover……so the likelihood of a sustained rally from this low is negligible. Regulators forget that short selling bans are counter-productive.
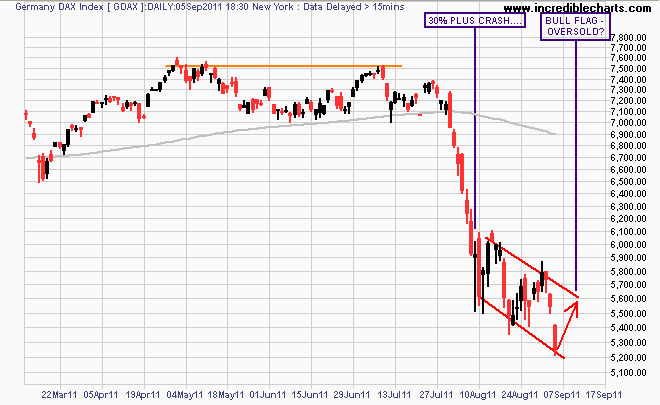
German DAX Bull Flag and oversold
But long term, this sort of action has many precedents – the German equity market is not as benign as you would think and is one of my favourite equity indices for trading (and it appears, many other traders).
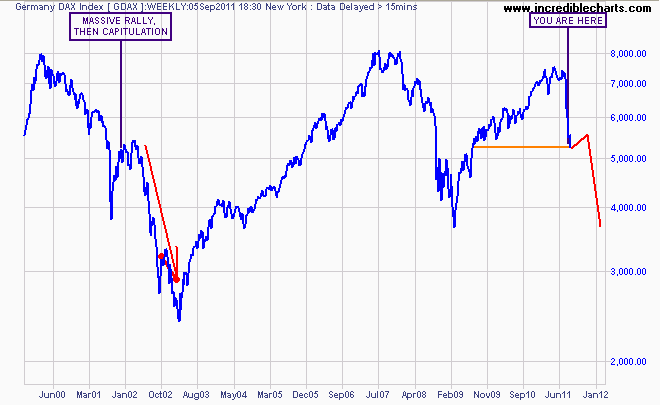
German DAX Weekly chart over 12 years - another "go nowhere" index
On to the USA, where trading will recommence tonight after the Labour Day long weekend. I’ve seen too many daily charts of the S&P500, so for some clarity, here is the weekly chart showing where we are now.
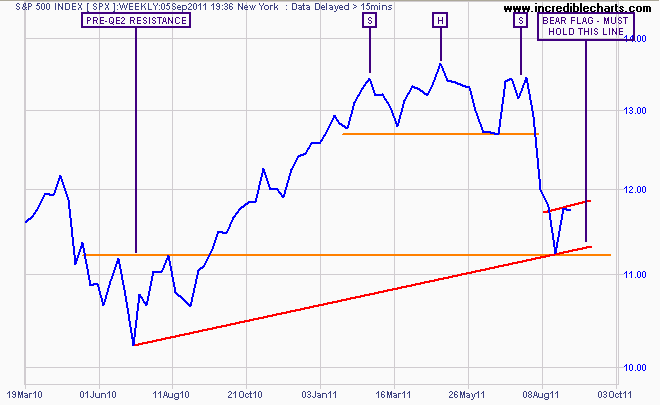
SP500 Bear flag on weekly chart. Note the trend line from pre-QE2 low
As for Asia, the Japan Nikkei 225 is actually holding up well in comparison, but is about to test the earthquake/tsunami low of mid March. A break below 8600 points in this rectangle holding pattern – which could be tested today – would likely see the world’s 2nd biggest equity market fall to support at 7000…
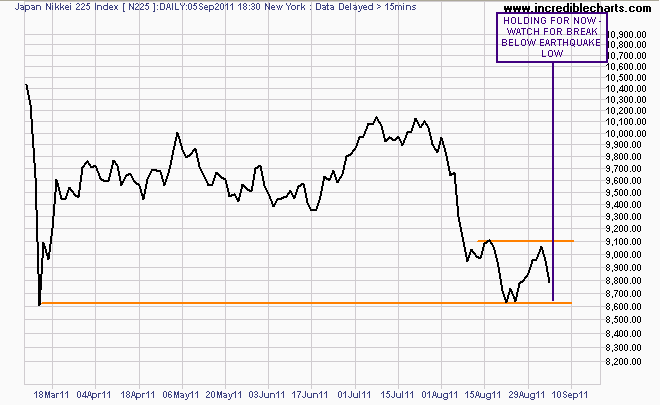
Japan Nikkei 225 - holding in a rectangle pattern. A break below would see a target of 7000
The Hong Kong Hang Seng Index has a more bearish pattern – another bear flag setup.
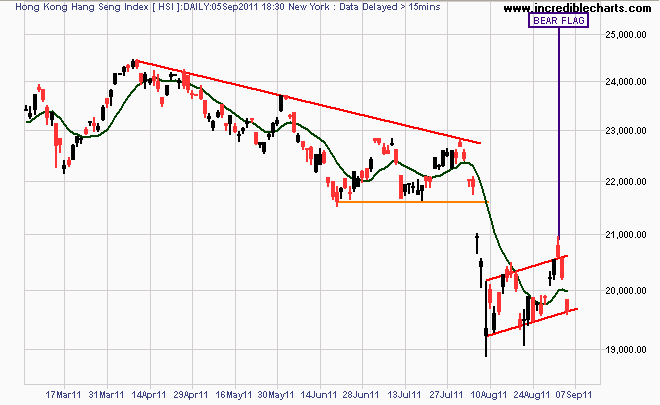
Hang Seng Index - bear flag pattern
And finally, an index I was going to look at properly today but will examine later this week, the China Shanghai Composite. Hands up if you think that the economy that “saved” Australia has a burgeoning, inexorable bull share market, reflecting its economic growth?
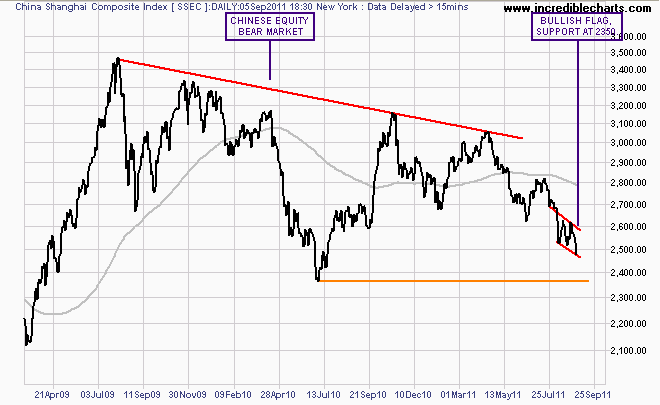
The bears are in China too..
Hate to disappoint, but there has been a bear market in Chinese equities for over 2 years now. The short term pattern is technically bullish, but since correlations between equity markets around the world approach 1.0, and the longer term pattern is a descending triangle (note the orange support line from pre-QE2), the likelihood of another leg down is high.