
The S&P/ASX 200 jumped again on the open, and is now up over 124 points or 3% at 4158 points.
Other Asian markets are experiencing similar big gains, with the Nikkei 225 up 1.15% at 9047 points, and the Hang Seng up further, up 3.3% at 19935 points.
Other risk assets are mixed, with the AUD stabilising against the USD, now at $1.0351 Gold is up slightly, now at $1756 USD an ounce. WTI crude has reversed, up 3% to $81.69 USD per barrel.
Movers and Shakers
It’s generally green across the board, with all sectors up. The banks are rallying strongly, with ANZ up 5%, CBA up 2% on the back of its earnings release, NAB up 6% and WBC up 5%. Macquarie is bucking the trend and is barely up 0.5%
The resource twins BHP and RIO are also taking part in the strong gains, up 3.5% and 3.9%. Cochlear (COH) and CSL – are up 3.5% and 2.9% respectively.
Today’s Chart
This is a very interesting rebound, after a mammoth volatility day yesterday (and yes, I did succumb to day trading, couldn’t help it with such an immense rally).
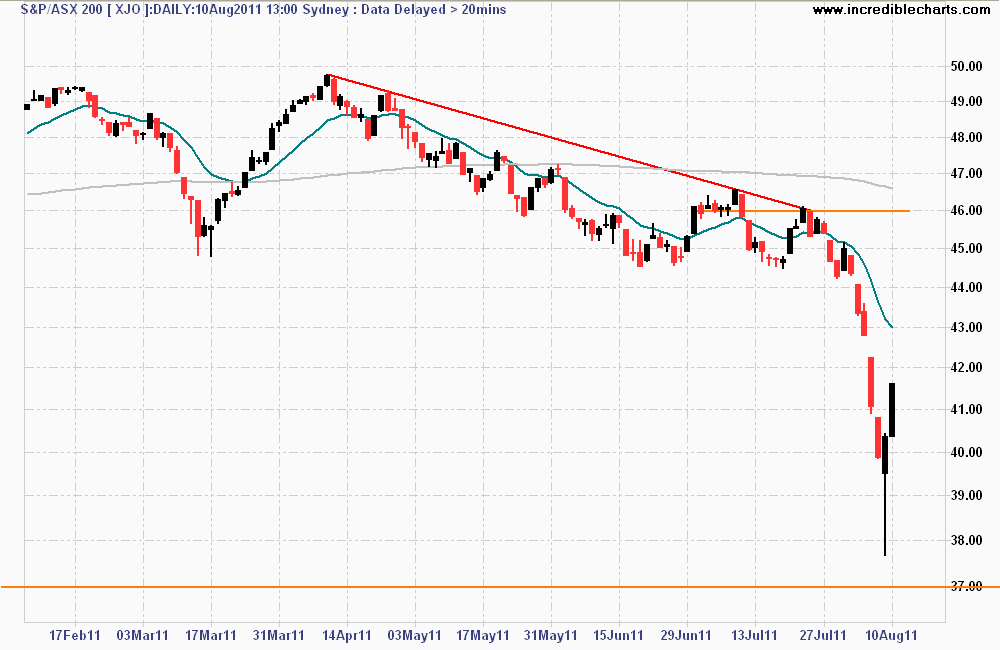
Daily chart of ASX200
As I’ve been saying, the Australian market will be going through some high volatility in the month ahead because of the full year earnings season (Australian companies only report twice a year), which will add to the overall market bipolar behaviour. The market could rally as high as 4500 points on the back of a “good” earnings season (which is backward looking in results, but forward looking on CEO/management sentiment).
But lets put something into perspective – h/t to Rota Fortunae who said:
There were at least 7 triple digit, multi-day [defiant] rallies in the 6 months between Sep 2008 and March 2009 (cue Mark to market and QE milky wilkies). Around those superb rallies, the ASX dumped 2000 points in 6 months.
Instead of GFC Episode 2 (Attack of the Sovereign Debt), I contend that the higher probability even will be a similar phase as from October 2000 to late 2003, where equity markets around the world fell up to 50% over a 3 year time period.
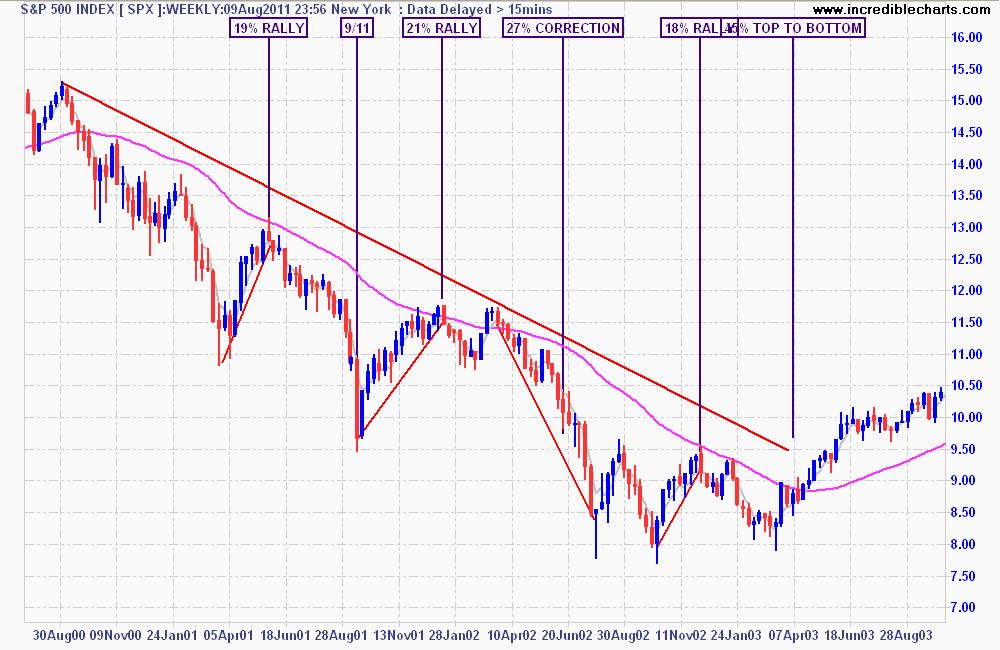
In the chart of the S&P500 above, each rally throughout this large bear market averaged 20% and lasted around 12 weeks or 3 months. (note that the market was falling before the 9/11 tragedy, so this cannot be counted as an aberration)
You will likely hear in the weeks ahead (from Gittins! et al) that everything is fine, as the market rallies, but consider the following projection carefully:
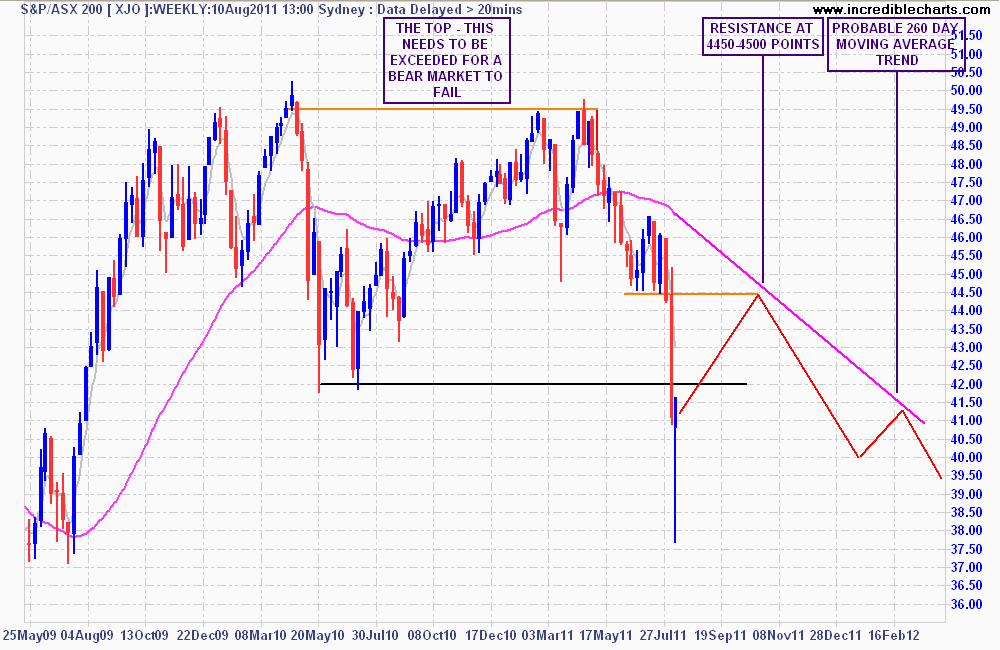
Weekly chart of ASX200 - projected to February 2012
Local earnings season continues – today its Flexigroup (FXL), Commonwealth Bank (CBA), Computershare (CPU) and Stockland (SGP). Remember to bookmark the overall update here.