
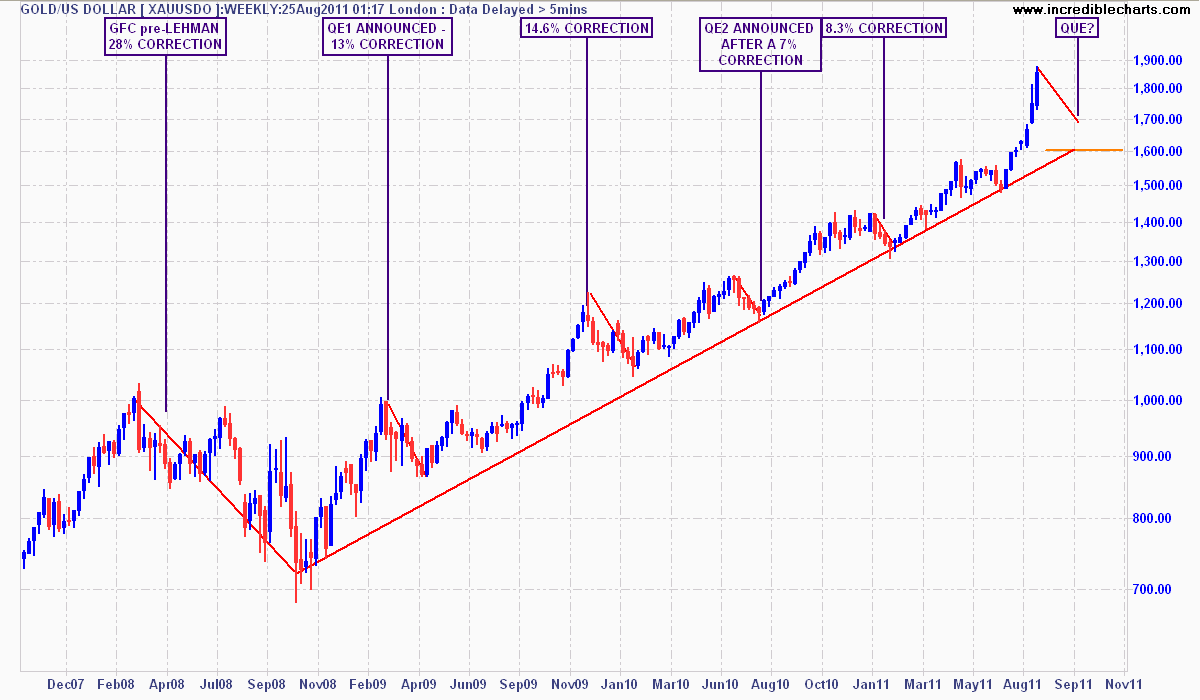
I’ve been following the gold price on MacroBusiness for sometime now, with my most recent piece a few weeks ago (and other comprehensive posts here and here) I placed the context of the move in the gold price in a weekly chart. Here is a better and larger view of that chart (click to enlarge to full size):
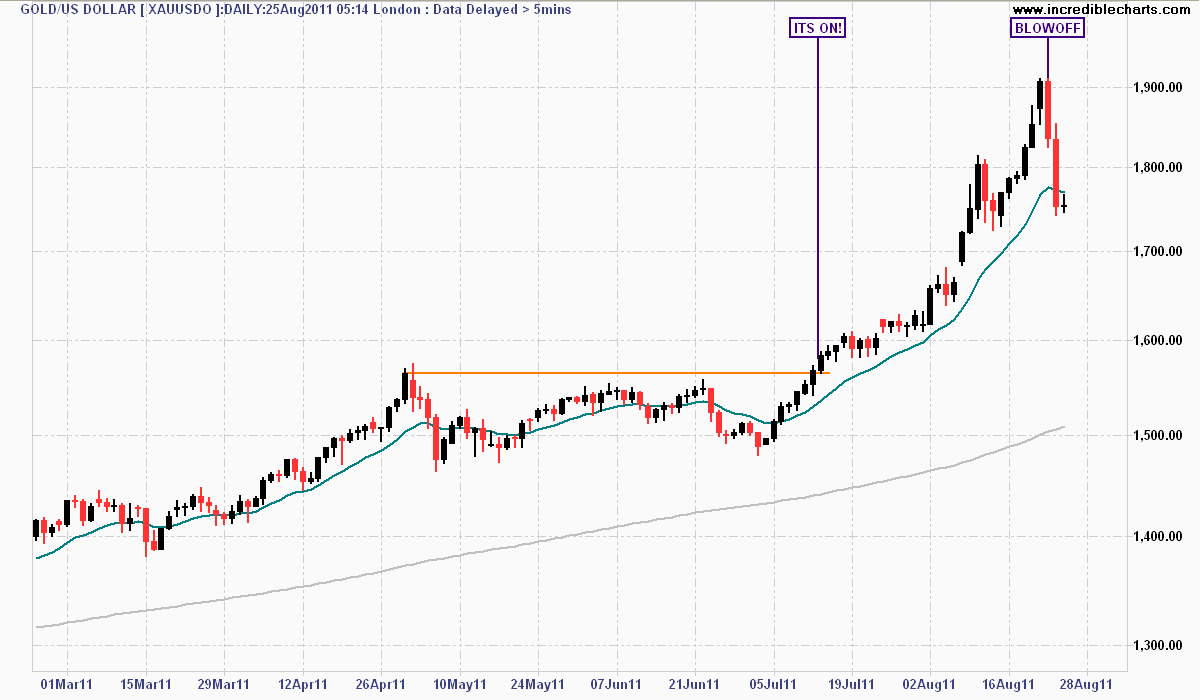
And here is the recent action, but using a daily chart:
Lastly, note that the current price is still only a weekly low. This correction is not yet over. From the weekly charts, we can determine that the average correction is on the order of 8-10%, although curiously, each subsequent correction is reducing in magnitude.
Another issue that makes this current two day correction (rightly called a “dip” for now) different to the past is that gold shot out above its weekly trend channel, even adjusted using a semi-log chart:
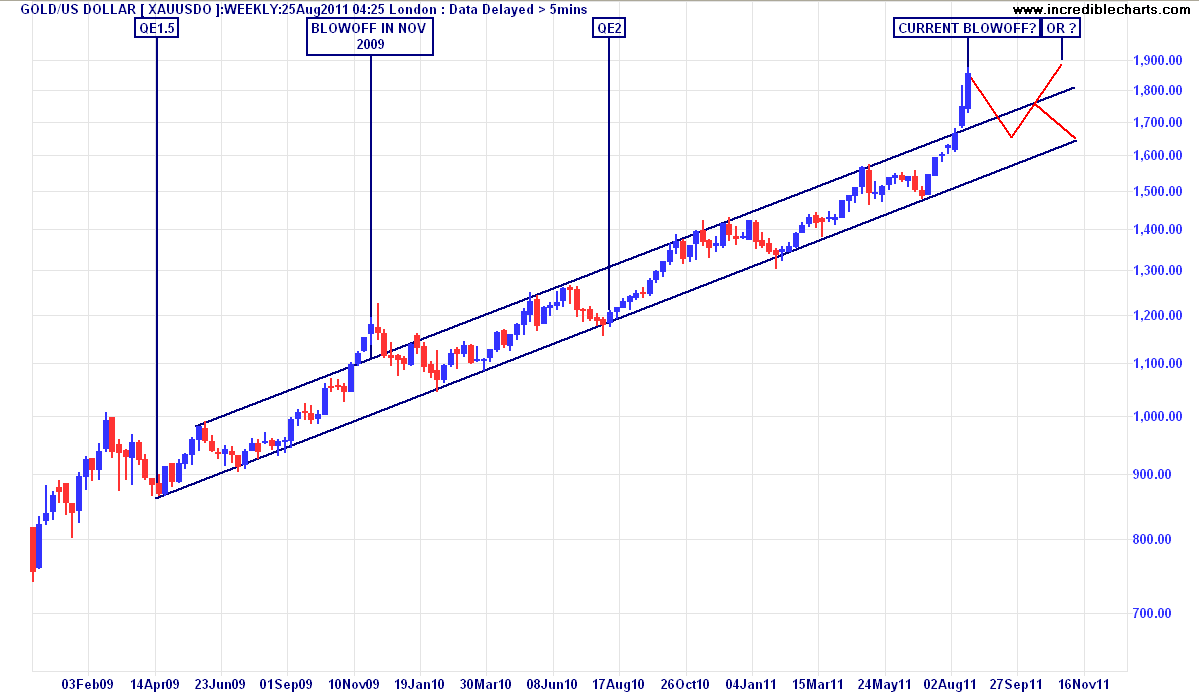
This happened in November 2009 as the first “Botox Boom” (h/t Satyajit Das) wore off and risk took time off over the Northern hemisphere winter. A return to the trend channel resumed thereafter with QE2, as much as it tried, failing to reach above the upper trend channel.
What caused the correction? The usual suspects – too much short term speculation and the subsequent reigning in of margin (both initial and maintenance) by large metals exchanges, notably the Shanghai Gold Exchange – 22% increase – and Chicago Mercantile Exchange, a 27% increase.
So the question remains, is this too much exuberance part of a normal correction amongst a typical bull market, or something else?
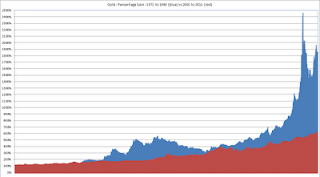
From a historical viewpoint, the gold bull market has now passed the 700% stage (a low of $250 in 2001) which compares with approx. October 1978 when gold first took out that level in its bull market (which then transformed into a bubble).
As The Bullion Baron said recently on his blog:
From 700% onwards is where Gold went parabolic in the 1970s bull market. If we are to see a similar move this time over a similar time frame then we have roughly 16 months left until the peak, I would say that puts us squarely in the early stages of phase 3 which is where I believe we are (media attention phase, but for different reasons).
He created this chart, which compares both markets, showing the percentage gain made over the period 1971 to mid 1980 (blue) vs the period 2001 to mid 2011 (red) (although it only has current data to the start of August, or $300 ago!)
The Phase 3 he alludes to is the “mania” phase of a bubble, shown here in a chart seen often, by Dr Jean-Paul Rodriguez:
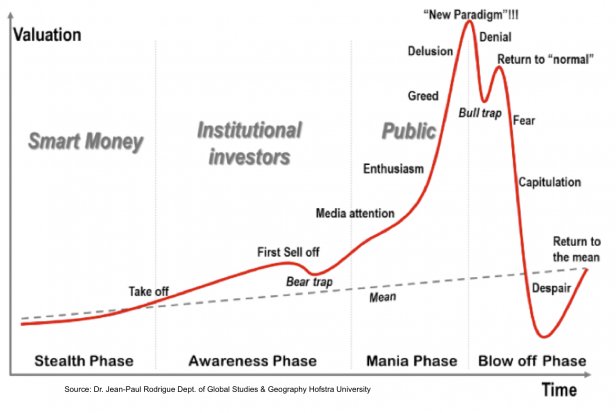
I’ve posted on gold’s possible position in this “bubble” before and contended we’ve been on the cusp of the “public” phase, with the GFC the first major sell off, causing a bear trap (gold corrected almost 25%). Given the queries I’ve taken from friends and acquaintances recently on “how to buy gold” as a backdrop to this current price activity I would suggest we truly are moving into the “enthusiasm” area.
In my mid July post, I considered a target of $1700 USD an ounce by the end of year.
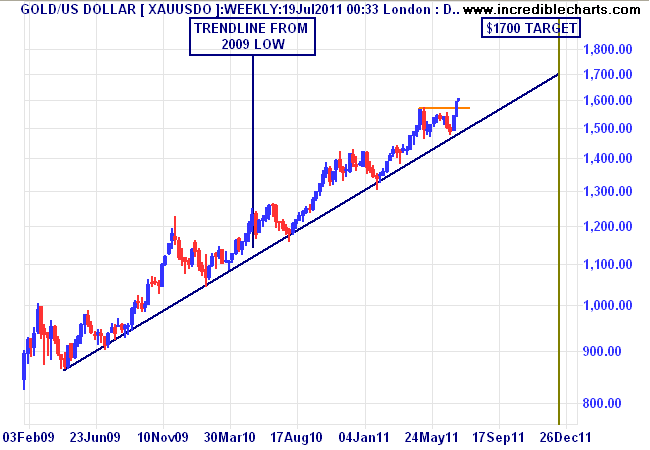
Gold in USD weekly prices extended to end of 2011 - posted 19th July
This could still occur as gold corrects 8-10% from $1900 to approx. $1700 over the next few months, whilst resuming its secular bull market trend. As I said:
Of course, what we are talking about here is the broad assumption that gold will inexorably continue its bull market, flittering from one economic and monetary crisis to the next, with no end game in sight.
However, there is a now a stronger chance than ever that an end game is here with a deficit in leadership, effective monetary and fiscal policy, balanced by the surplus of in-fighting, in-action and ineptitude in solving a 4 year old crisis.