
Advertisement
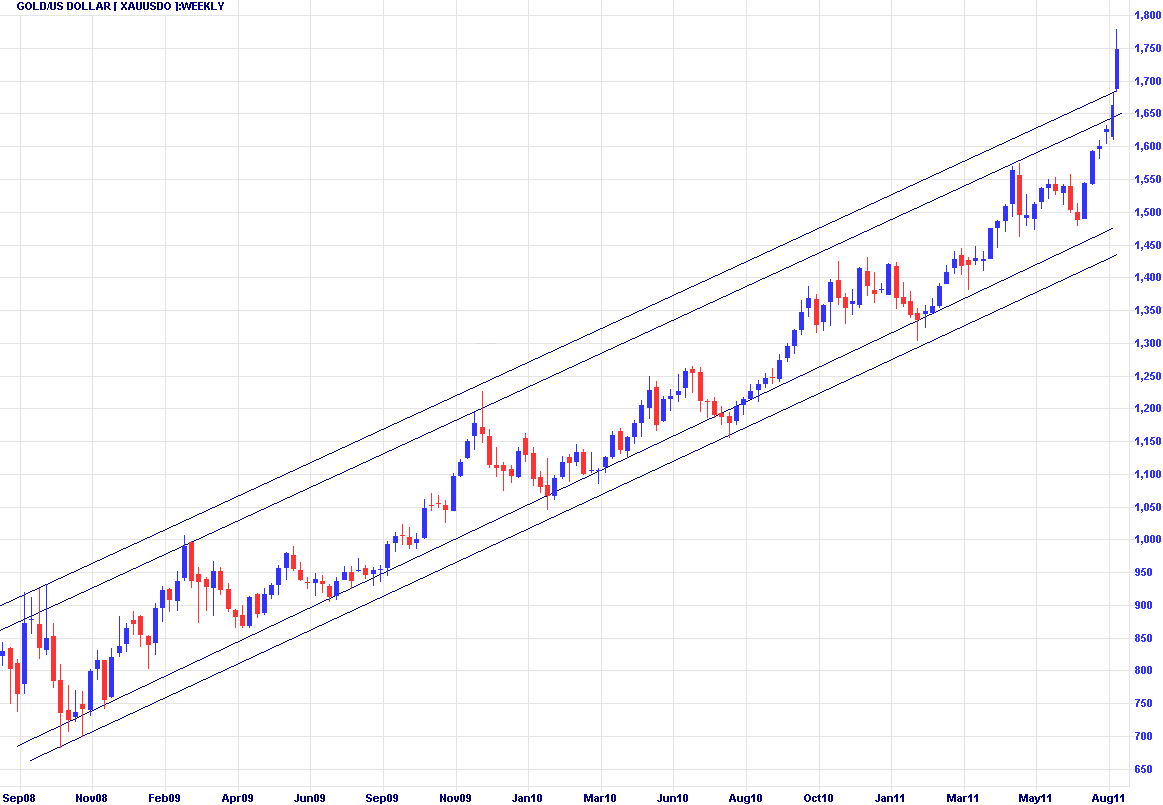
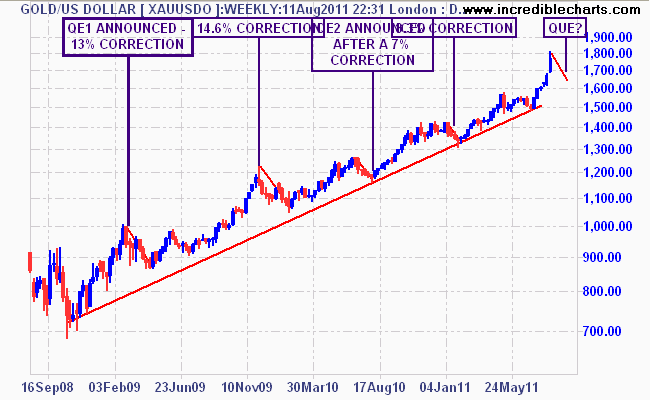
Today’s chart starts with a weekly overview of the price of gold in USD since the GFC, from The Bullion Baron:
Then we go to the last few days, where the gold price has ranged within $100 per ounce:
Is this the true start of the gold bubble, with a breakout above the weekly trend above or a correction in gold to its long term trendline, which has occurred throughout all major ructions on risk markets since the GFC?
Advertisement
Advertisement