
The S&P/ASX 200 rose about 15 points on the open, but has retraced after waiting for the RBA Board decision on rates at 2.30pm AEST. It is currently 5 points or 0.12% down just after midday, at 4605 points.
Other Asian markets are also mixed, with no leads to follow from Wall Street due to the July 4th holiday, with the Nikkei 225 down 0.15% at 9949 points, and the Hang Seng steady at 22,761 points.
Other risk assets are up, but the AUD is slipping and is barely above 1.07, whilst gold continues to climb back to $1500, now at $1497.20 USD an ounce. WTI crude is steady at $94.73 USD per barrel
Movers and Shakers
It’s mixed across the board. The miners are posting gains whilst the four major banks are mixed – mainly down. ANZ is the only winner, up 0.14%, with NAB the biggest loser down 0.87%. BHP is up nearly 0.6%, at $44.29 and RIO up 0.3% to $83.38
In other ASX200 stocks, OMH is up 9% on bottom picking, whilst Macmahon (MAH) is up 3.5%, followed by a rebound in Onesteel (OST) up almost 2%.
Tiger Airway’s woes are still the other airlines gains, with QANTAS (QAN) up over 1.2% and Virgin up similarly.
The losers include Murchison Metals (MMX) down 13%, Paperlinx (PPX) down nearly 10% with financial services firm IOOF (IFL) down almost 3%
Daily Chart
The daily chart significant resistance at or about 4600 points since the channel breakout. This is a classic sign of a “dead cat bounce“. So far, this is a weak rally as we head along into a very strong data week – kicked off by the retail and building approval figures yesterday, the RBA rates decision today and the all important US employment figures this week. All major companies and sectors are experiencing weak rebound rallies with no standouts (except the airlines, but why you would want to buy them at any price is beyond me). I still contend that 4500 points is the major resistance level if the market falls again – there have been too many losers in the last 2 years to hold on to stocks, and its this losing sentiment that drives markets.
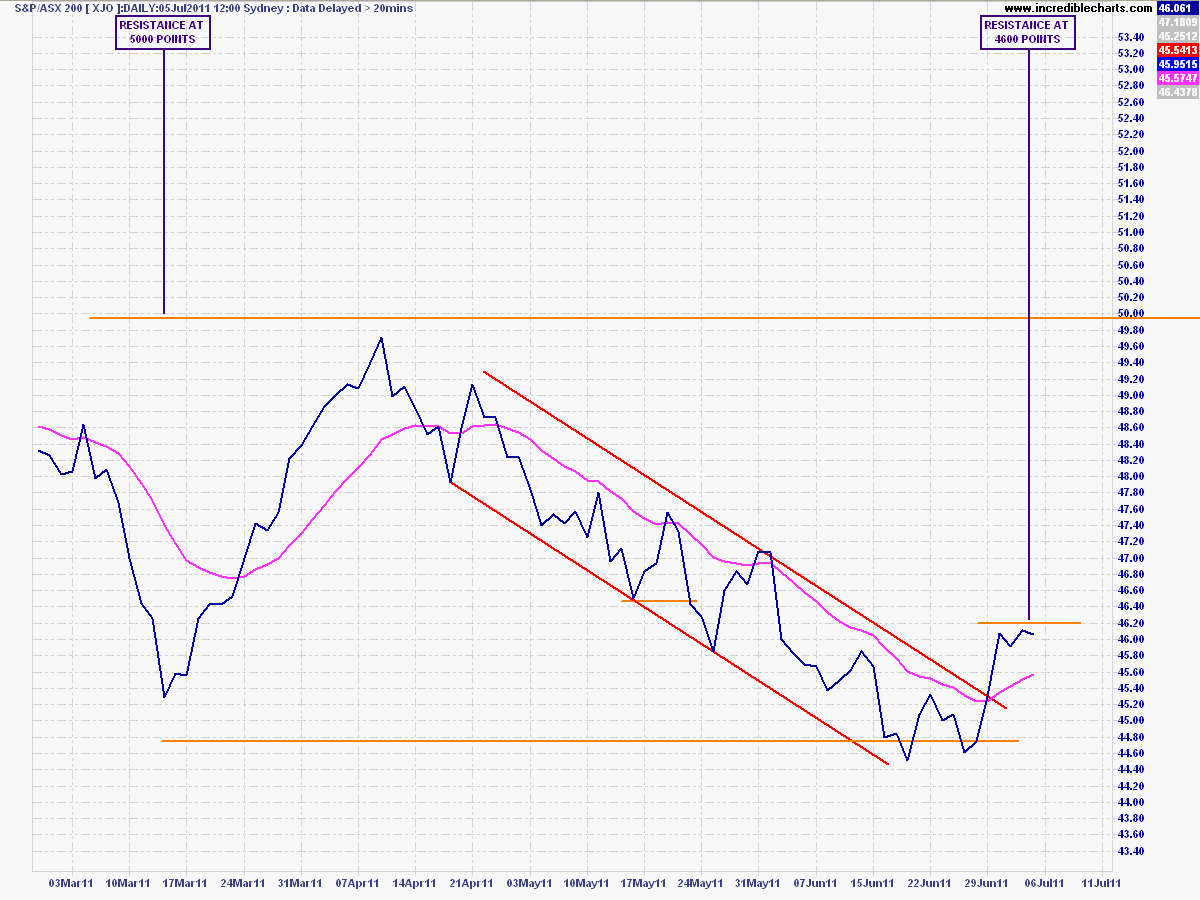
Daily chart - 15 day moving average in pink - click to enlarge
A Tale of Two Corrections Redux
A month ago I posted a chart study, comparing this correction and the past 2 years of price action with the sideways/bearish market of 2001-2003. The chart below rang a bell with readers and followers of the market, and continues to give some idea of where we are going – note how there was also an “impulse” rally where support was tested but then failed a week or so later.
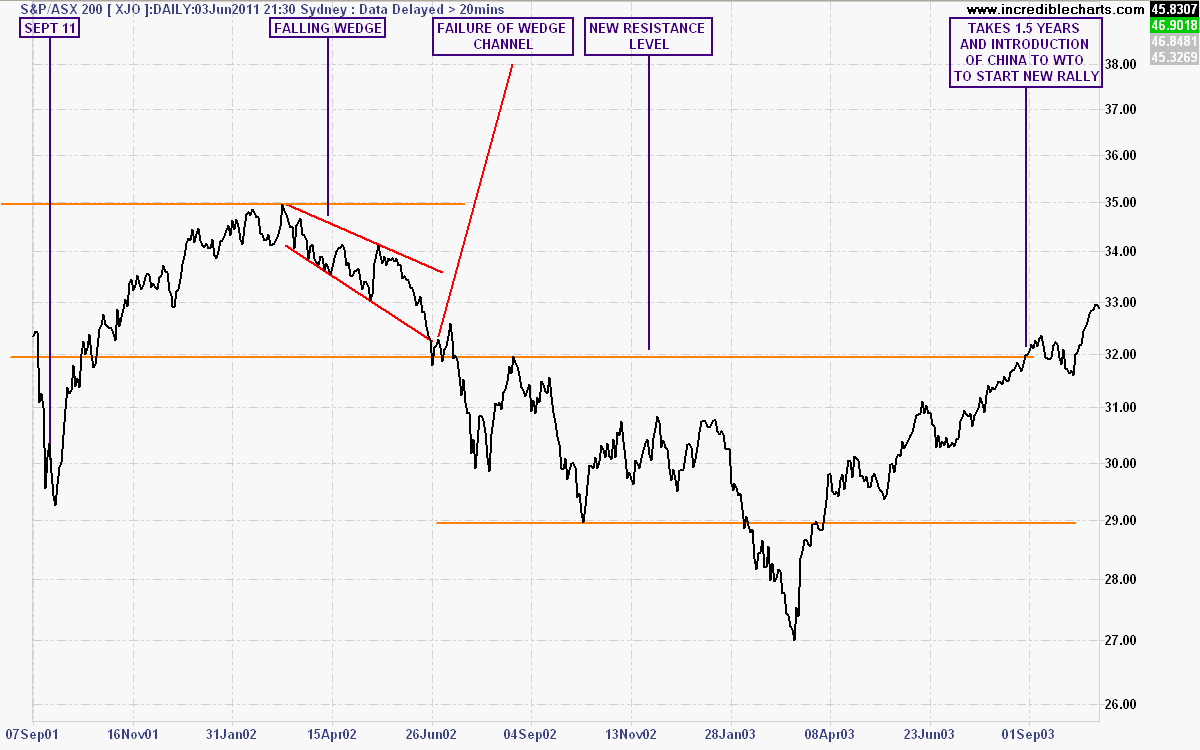
Click to enlarge full size