
The past 2 years of volatility on the ASX200 is similar to those of us who witnessed or have intently studied prior market corrections. As opposed to the usual bullhawks and “everything is fine” brigade, stock markets actually experience more sideways movement than rallies over their history.
The 2000-2002 post-tech bubble market is eerily similar to the current situation, from a macro viewpoint (i.e after and during monetary attempts to stimulate a post-bubble economy) and a technical price viewpoint.
I want to show a study I’ve been conducting regarding price behaviour, which may give an insight into future possibilities of price movement on the ASX200. I’ve included four large charts (click to open in new window) of 2 two-part episodes of price action.
2000-2002 Part 1
The chart below show the post NASDAQ bubble, the September 11 correction and subsequent rally and the curious falling wedge pattern thereafter.
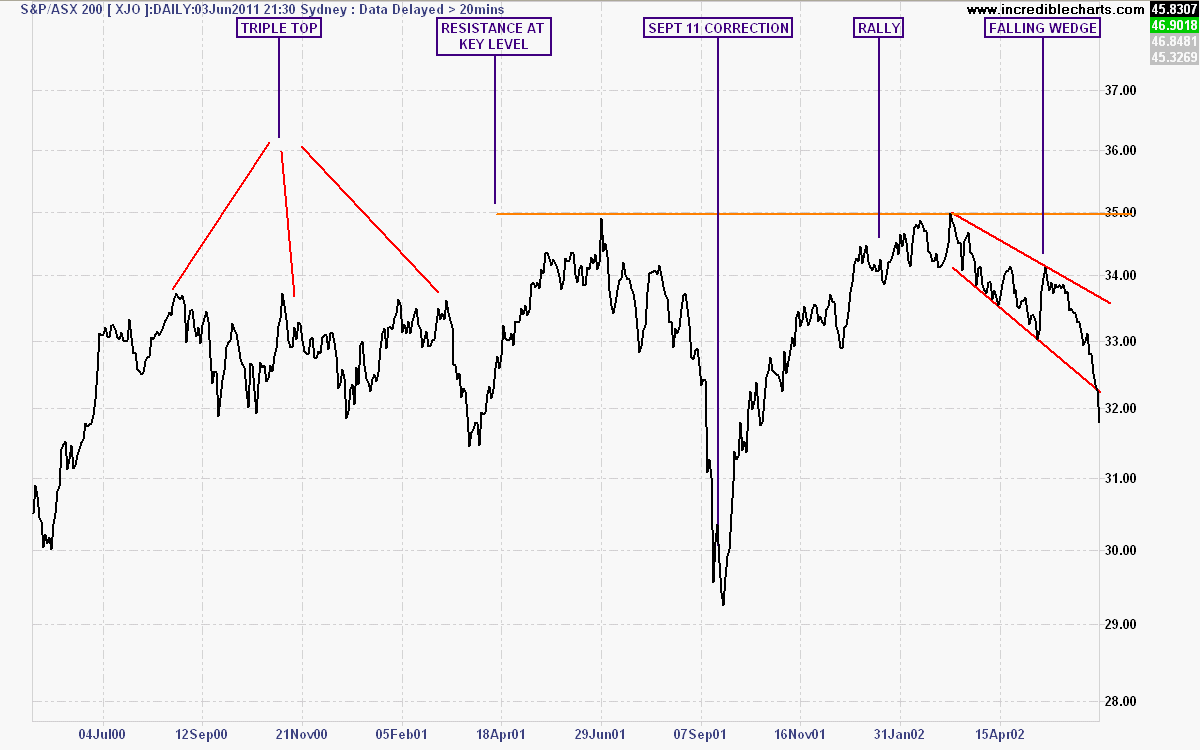
ASX200 from 2000 to 2002
Note the technical patterns – a triple top in late 2000, as the market fails three times to exceed new highs. A small correction reverses into a new high almost breaching the key 3500 point level, before the Sept 11 correction wipes out almost 20% of the market. A subsequent “euphoria” rally (mainly pushed in the US by defense stocks) pushes the market back up to its key resistance at 3500 points again, but this is met with a broad selloff, encapsulated in a falling wedge pattern as the market heads into May of 2002.
2009-2011 Part 1
The chart below shows the post QE1 bear market rally, the Greek induced flash crash of May 2010, the new QE2 induced rally, the Japanese earthquake correction and subsequent rally and the falling wedge pattern thereafter.
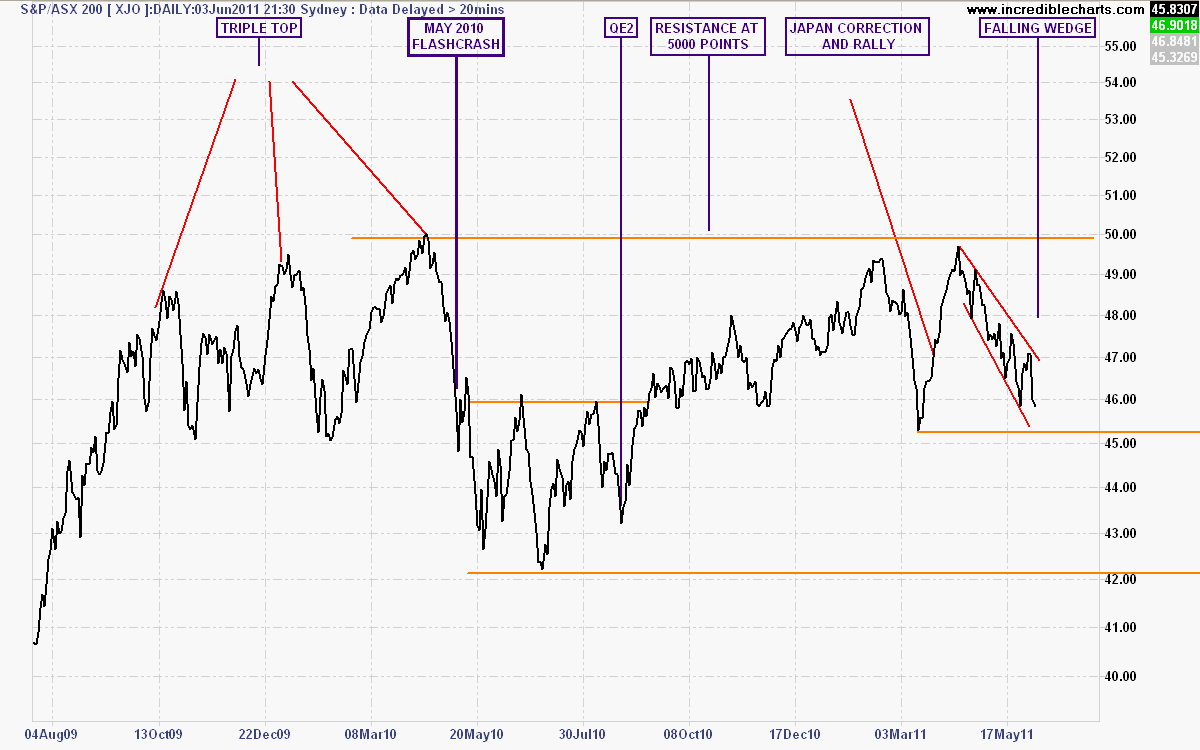
ASX200 from late 2009 to now
Note the technical patterns – a triple top in late 2010, as the market fails three times to exceed new highs. A large correction due to the May 2010 Flash Crash is only reversed by the announcement of QE2 by the US Federal Reserve as markets begin rally back to the key resistance level. The Japanese Earthquake and MENA events cause a sharp correction, with a very quick “euphoria” rally pushes the market back up to its key resistance at 5000 points again. Another broad selloff occurs, encapsulated in a falling wedge pattern as the market heads into May of 2011.
Sound familiar? I’m not going into macro causation here just comparing price patterns, but remember it was the Fed easing programs (reducing interest rates to absurdly low levels) post-tech boom and post-9/11 that are also eerily similar to the schedule of events in the last 2 years (almost ZIRP, then QE, QE-lite, QE2……)
Where are we going then?
Let’s look at Part 2 of the 2000-2002 events to see where we might be going.
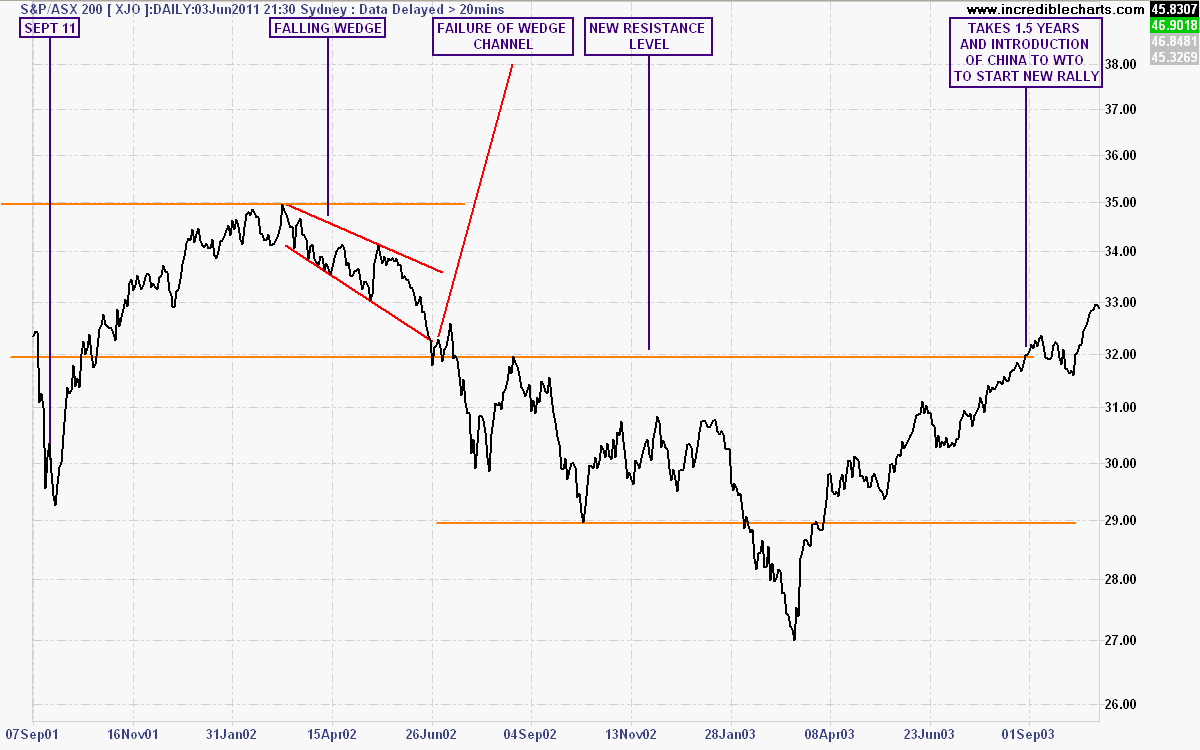
Part 2 - a bearish sideways market for 18 months
The falling wedge pattern fails its lower channel and prices slump past the key support level – which now becomes resistance. This level – 3200 points – was the support level below the triple top formation, and is a price at which buyers will not consider higher prices.
As the market begins a sideways bearish phase, it rallies and corrects within a broad channel, including the inevitable overshoot as all buyers lose hope and fear grips the market. This overshoot (an almost identical pattern occurred from late 2008 to early 2009, with the bottom in March 2009 serving as the overshoot bottom, not the real bottom) turns into a new rally that takes 18 months to reach the lows of the falling wedge pattern.
A possible 2011-2013 pattern…
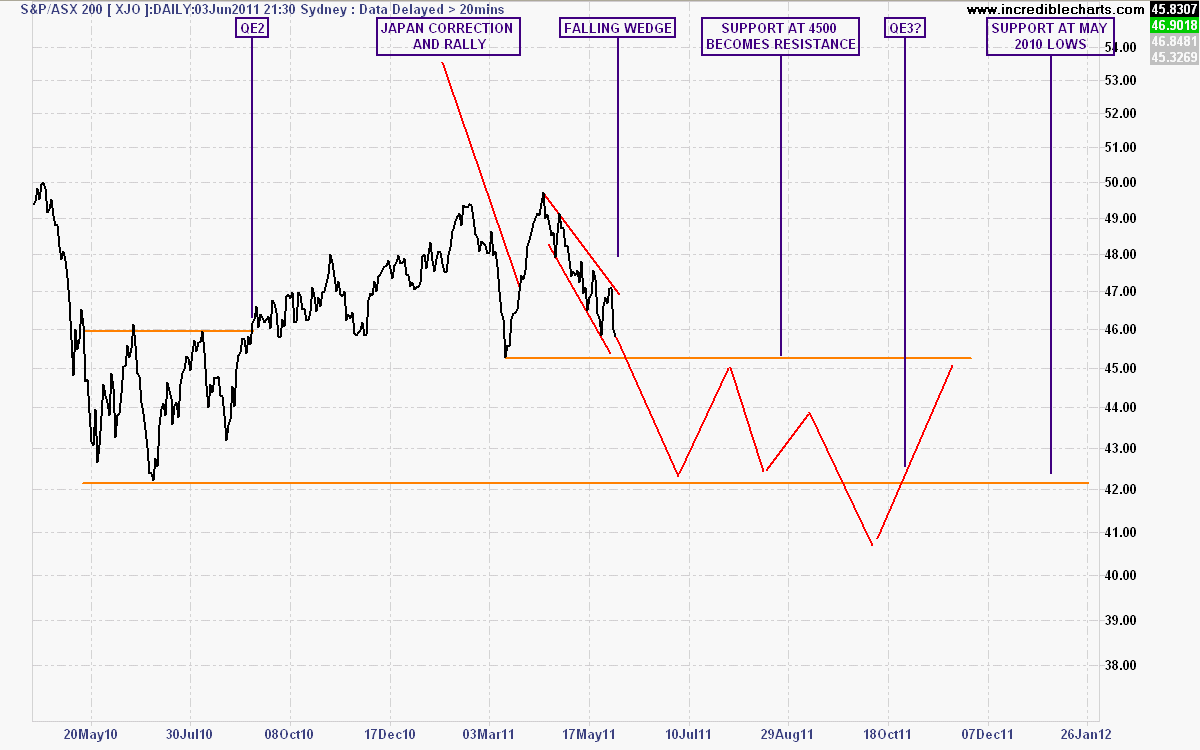
A bearish sideways market going into 2012?
In this illustration, I’ve assumed a similar price pattern, as the lack of monetary stimulus drives share prices to new lows. The key events here are a failure of the falling wedge pattern below the Japan correction low at 4500 points. This is followed by a broad trend channel formed between the new resistance level of 4500 points (the old support level) and the May 2010 support level of 4200 points.
It is likely that this point may be breached by a fearful correction, and then a new rally begins – possibly as the US and other nations begin/continue stimulus packages. But what is likely is that this sideways bearish phase – like it has occurred more times than bull markets – will last at least 12-18 months, and perhaps for a few more years yet.
This is not a buy and hold (hope for capital gains) market condition, by any stretch.