

Advertisement
With the ridiculousness of the US debt ceiling theatrics still playing out, the markets are having none of it. See below for the breakout in the Euro against the USD:
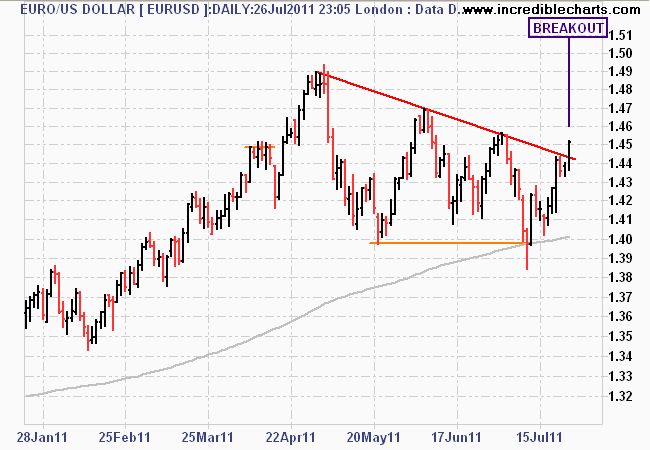
EUR/USD 6 month daily candlestick chart with 260 day moving average (grey line)
And the GBP against the USD:
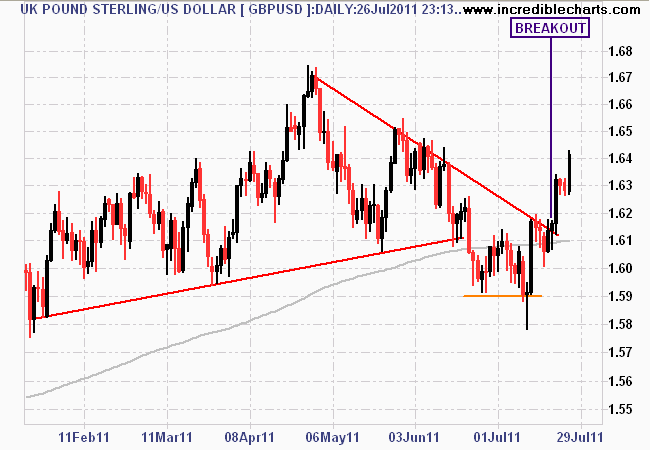
GBP/USD daily chart - earlier breakout this week
Of course, things haven’t changed for the de facto “gold” standard of currencies, the Swiss Franc (CHF). This 41 year, monthly chart (in semi-log scale so you can see the devastation) explains why.
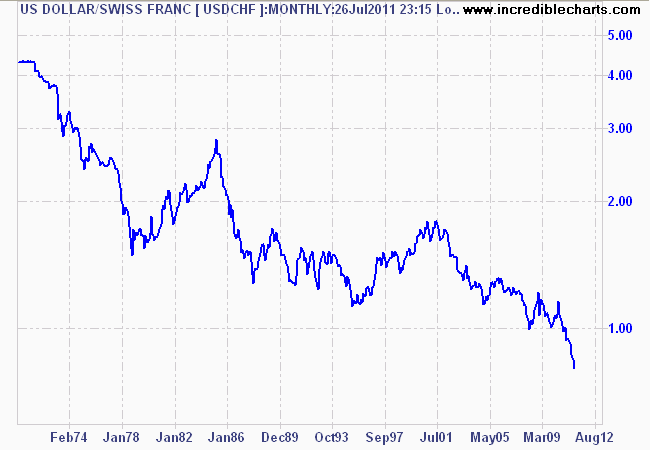
USD/CHF monthly chart for last 41 years.
Advertisement