
The S&P/ASX 200 rebounded on the open from positive leads from “rally” in US and EU markets on Friday, but has since gone slightly in the red, or 2.5 points down, back below 4500 points just after midday.
Asian markets are actually up, with the Nikkei up over half a percent to 9406 points (just above its medium term support), the Hang Seng also up 0.54% and Singapore even stronger at 0.8%.
Other risk assets are mixed, the AUD is still above 1.05 against the USD although retreated from over 1.06, gold down marginally to $1538 USD an ounce after a big surge on Friday (possibly due to lowering of margin requirements). WTI crude continues to fall, and is now at $92.35 USD per barrel.
Movers and Shakers
It’s mixed across the board. CBA, NAB and WBC are up 0.67%, 1.64% and 0.47% respectively, but ANZ is lagging, only up 0.33%
BHP is down two-thirds of a percent to just below $42 per share, but RIO is steady at $77.77 per share.
In other ASX200 stocks, Sigma Pharmaceutical continues its inexorable (sic) rise, up another 4% whilst Envestra (ENV) is up just over 3 per cent. The drop in oil prices is affecting Woodside (WPL) down over 1.3% whilst Caltex (CTX) is suffering from a profit downgrade as well, down over 6%. The biggest loser has been Platinum Australia (PLA), down almost 11%
Daily Chart
The daily chart shows how the current price activity remains at the low point of the Japanese/MENA lows of March. A break of support at 4500 points is very bearish in the short and medium term.
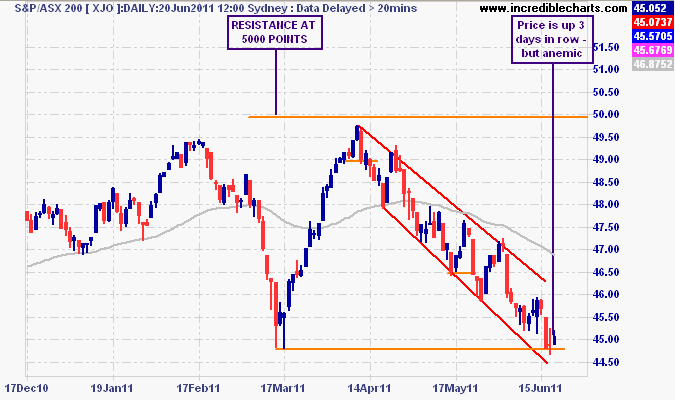
Daily chart with 63 day moving average (grey)
ASX200 still below critical support at 4500 points
A sustained break below this level will extend the correction, with the next target at 4200 points – the lows in the May flash crash of 2010. I expect an “impulse” rally to test the 63 day moving average (grey line), similar to other rallies or “dead cat bounces” during large correction phases. This will be an opportunity for once bitten bulls to dump their shares at smaller losses and for bears to add to their shorts, so be wary of these rallies, to say the least.
A Tale of Two Corrections
A couple weeks ago I posted a chart study, comparing this correction and the past 2 years of price action with the sideways/bearish market of 2001-2003. This chart may ring a bell with readers and followers of the market, and give some idea of where we are going.
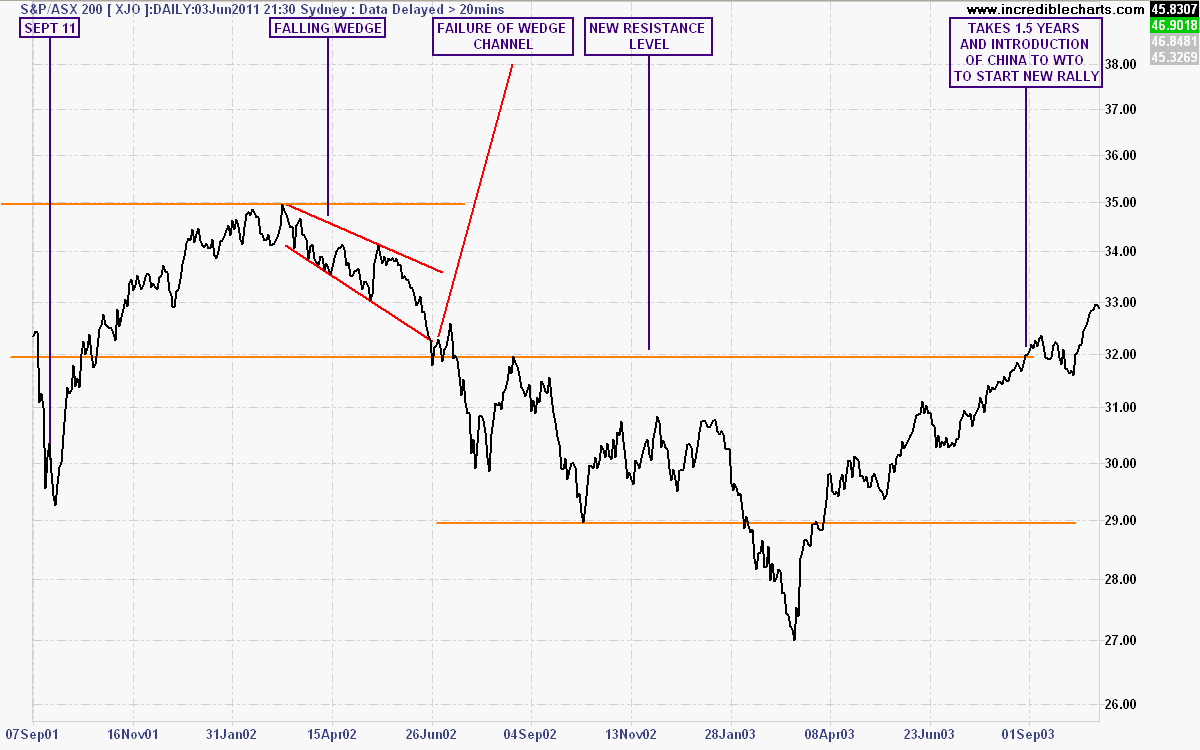
Click to enlarge full size