
The S&P/ASX200 index closed 0.91 per cent higher to 4,742.6 points on Friday, after a strong rebound rally. The index is up 116 points or 2.5% for the week, but still down 1.75% since the start of March and no movement at all for the year.
For a primer on how I do my analysis, read last week’s post.
Monthly Analysis
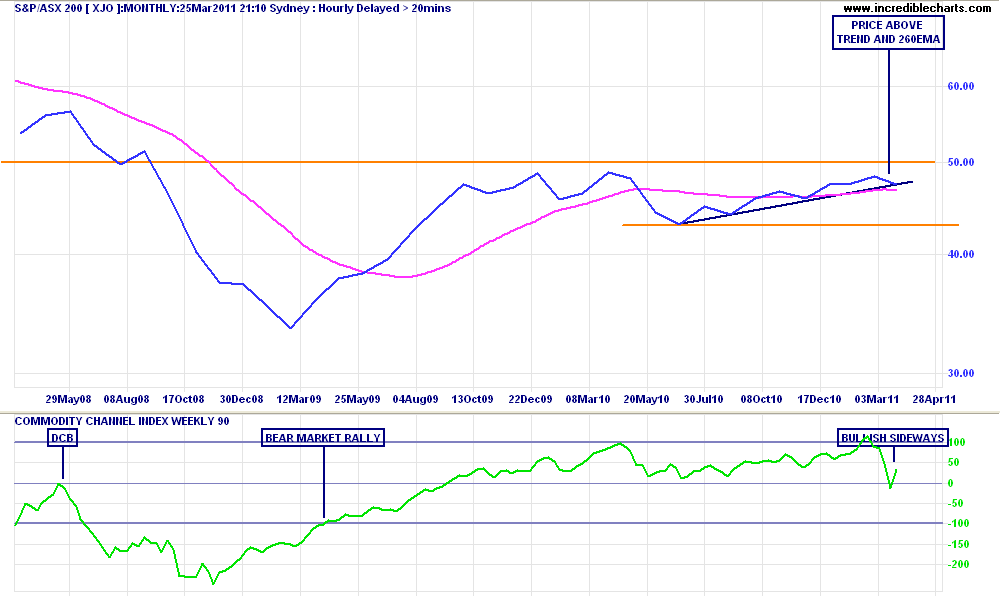
The monthly price is firming up, but still within a sideways band (between 4200 and 5000 points), although above the 260 day moving average, which is steady. The cylcial indicator has moved back to a bullish sideways reading after last week’s correction.
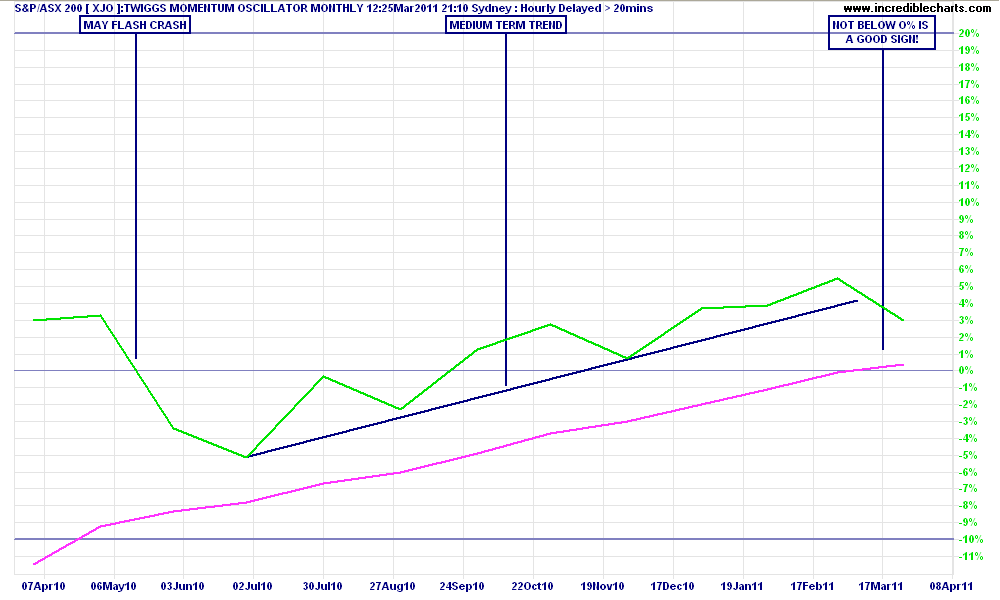
A check of the long term momentum indicator shows a return to a bullish long term condition, with the TMO and its own moving average (used to smooth the reading) above the 0 line, indicating further support, but no long term bull market conditions exist at this stage.
Conclusion:Mildly bullish/sideways in the medium term. Readings do not indicate a new bull market, just a new rally within the secular bear market.
Weekly Analysis
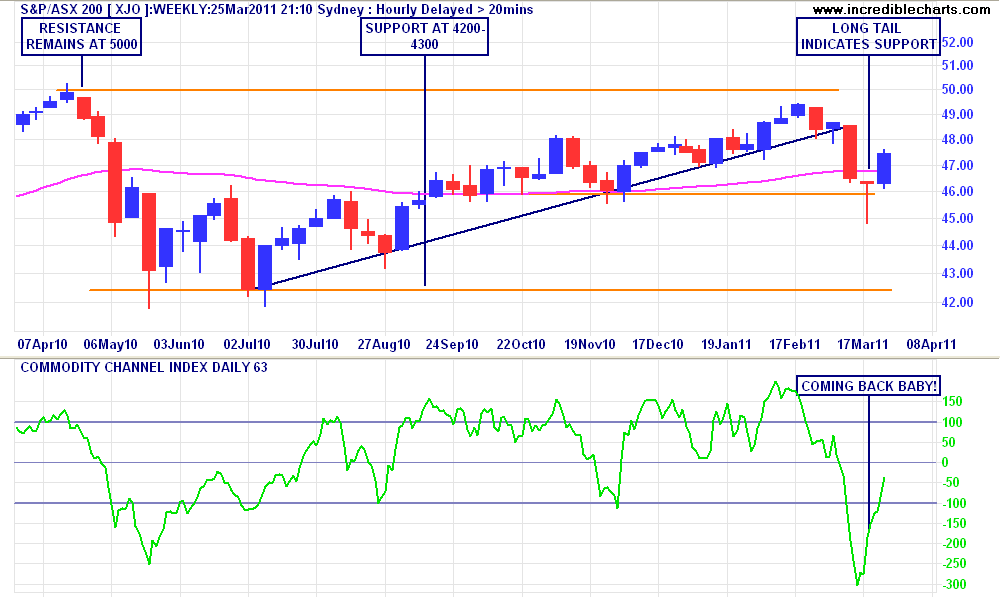
Scaling down to the weekly charts and 1 year timeframe there are two main indicators of a bottom reading. First, last weeks reading showed a very long “tail” closing above support at 4600 points – this indicates very strong support by institutions/traders. Second, the bullish blue candle of last week’s price action, combined with a close above the 260 day moving average and a cross over of the -100 line on the medium term cyclical indicator.
Adding these factors up leads to a very strong probability of a price bottom. The 4600 support area has been the historical bottom of the trading range since September of last year.
Conclusion:
The Japanese/MENA correction appears to have found a bottom and rebound off historical support at 4600 points. These are good signals for slightly bullish, medium term non-directional traders (i.e option/spread sellers) only.
Daily Charts
Now, to the daily chart. The market has been on a tear this week, a total of six consecutive up days, with Friday’s close a little “too fast”. The daily long tails have been replaced with “heads” – strong bullish blue candles on Thursday and Friday. My gut is telling me that this is a little too quick and we might see some retracement on Monday or Tuesday.
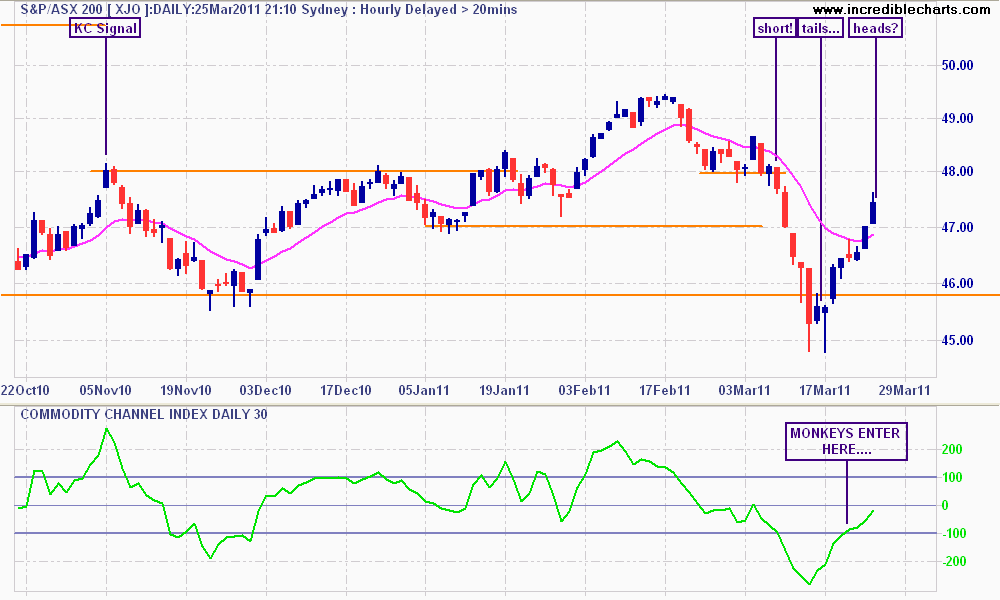
The cyclical indicator shows a strong monkey-picking bottom signal, and is firming up as bullish (crossover of the 0 then 50 line to confirm). Momentum too is positive.
Conclusion: Short term conditions obviously display a rebound rally after a good sized correction. Recent action is a little too fast and may imply a short pullback or sideways day(s) early next week. All the signals are there for a rally to continue.
Overall Summary
The secular trend for the ASX200 (XJO) is still bearish, but within there is a definite bullish/sideways bullish bias, with a major correction having found strong support instead of falling to new lows.
As I considered last week, a new post-correction bottom has formed and the likelihood of this being a Dead Cat Bounce has passed (excluding future meltdowns). Behaviour wise, it seems risk markets are willing to take a lot in their stride, when even bad news is absorbed as another reason to BTFD.
The XJO is likely to continue a short term rally in the week ahead, with a possibility of a small consolidation/slowdown period – excellent entry points for directional traders. Those of who remain long term bearish (which includes me) can still profit from short and medium term rallies amongst the secular bear market.
“He Too Fast”
This week’s “kicker” theme/concept to my analysis is a “signal” I’ve discovered that I’d like to share with you. I call it the “KC Signal” for reasons I will get to soon – but basically its a rudimentary method on how to spot a runaway share price. I use it as both an “waiting” entry and “sell into strength” signal.
The signal is simple: look at price action and the short term cyclical indicator. You can use a Relative Strength Index indicator instead (8 day weighted seems to work best).
For price action, I’m looking for a very strong up day that has gapped up – i.e the open is way above the previous day close and intraday high. A further confirmation is a long upper tail, which shows a lot of intraday selling, but the candle still remains tall, with a high closing price.
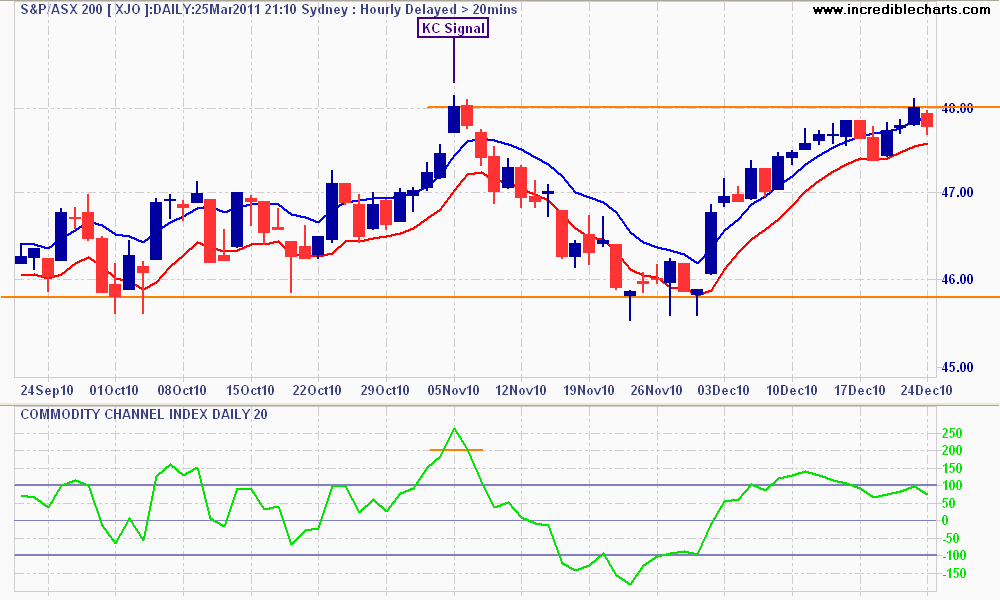
Now look at your overbought indicator: I prefer the short term CCI with a reading above 200 being my confirmation (use 90 for RSI). Rudimentary, but it seems to work.
As an “waiting entry” signal – but only for trends I am not yet long – I watch the next few days carefully. If the subsequent retracement does not go below the KC Signal day intraday low, buying support is still very strong.
As a “sell into strength” signal for short term trends I’m long, its a perfect opportunity to sell at a much higher price. The probability of price continuing to zoom higher is low – at least for ASX100 stocks. Mining exploration/speccie stocks have a higher probability of continued exponential price action, so don’t be surprised if your smug intra-day profit taking leaves considerable paper profit on the table….
Why KC?
 And why is it called the “KC” Signal – I’m a MotoGP fan (you might have guessed from my featured images), and when Casey (KC) Stoner came onto the scene, 7 time world champion Valentino Rossi had a lot of trouble keeping up with the then (still) fiery youngster. His post-race press conference, after Stoner beat not just him, but the whole field, always began with his thick Italian accent – “KC…..ehhh…he too fast”.
I used these same words when trawling through decades of price data witnessing the as yet unnamed KC signal popping up every now and again and it kind of stuck. Congratulations on the win last weekend at Qatar Casey by the way!