
Intergenerational Report spins productivity growth fairytales
The Australian newspaper has recently published a detailed report showing how Australia is facing its worst decade of productivity growth in more than 60 years of records, following last decade’s anaemic growth, which is currently the worst decade on record:
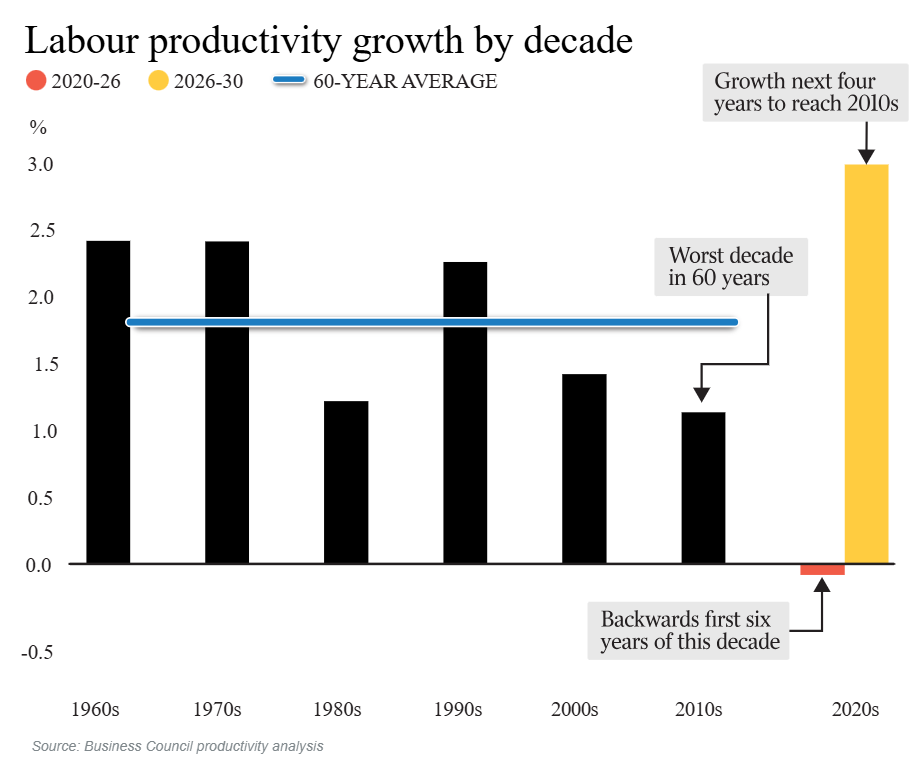
Chart from The Australian newspaper
Australia’s labour productivity growth this decade has ranked among the very poorest in the advanced world:
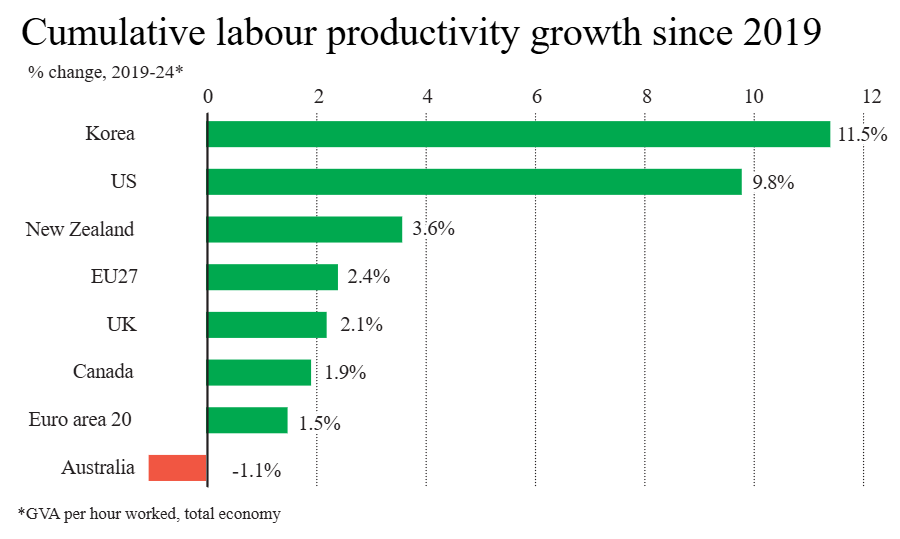
Chart from The Australian newspaper
In fact, Australia is one of the few nations to have recorded negative productivity growth over this period:
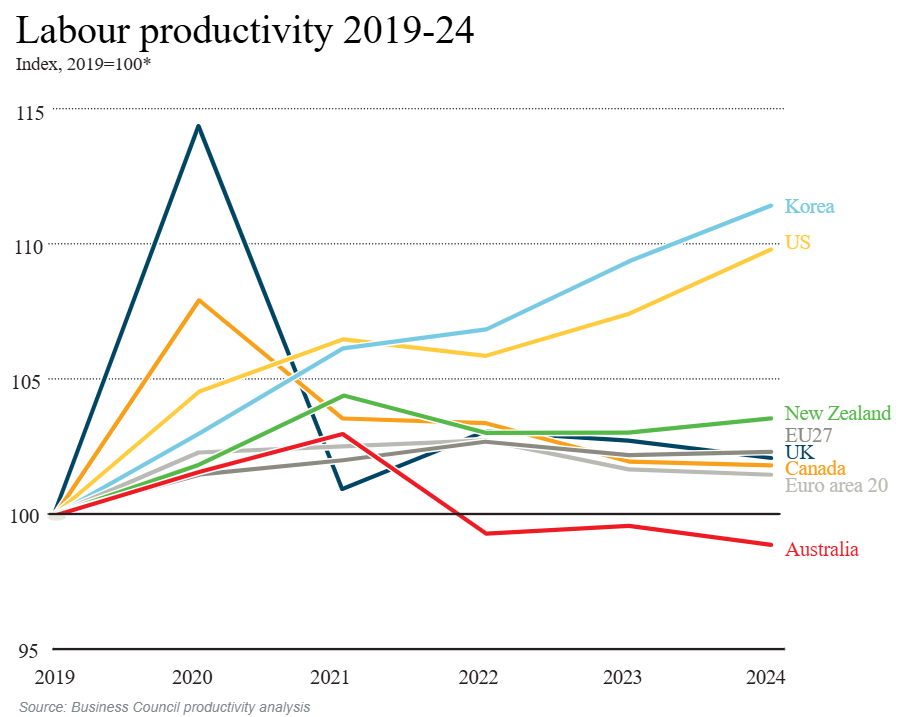
Chart from The Australian newspaper
Not surprisingly, then, Australia’s per capita GDP growth has badly underperformed other advanced nations:
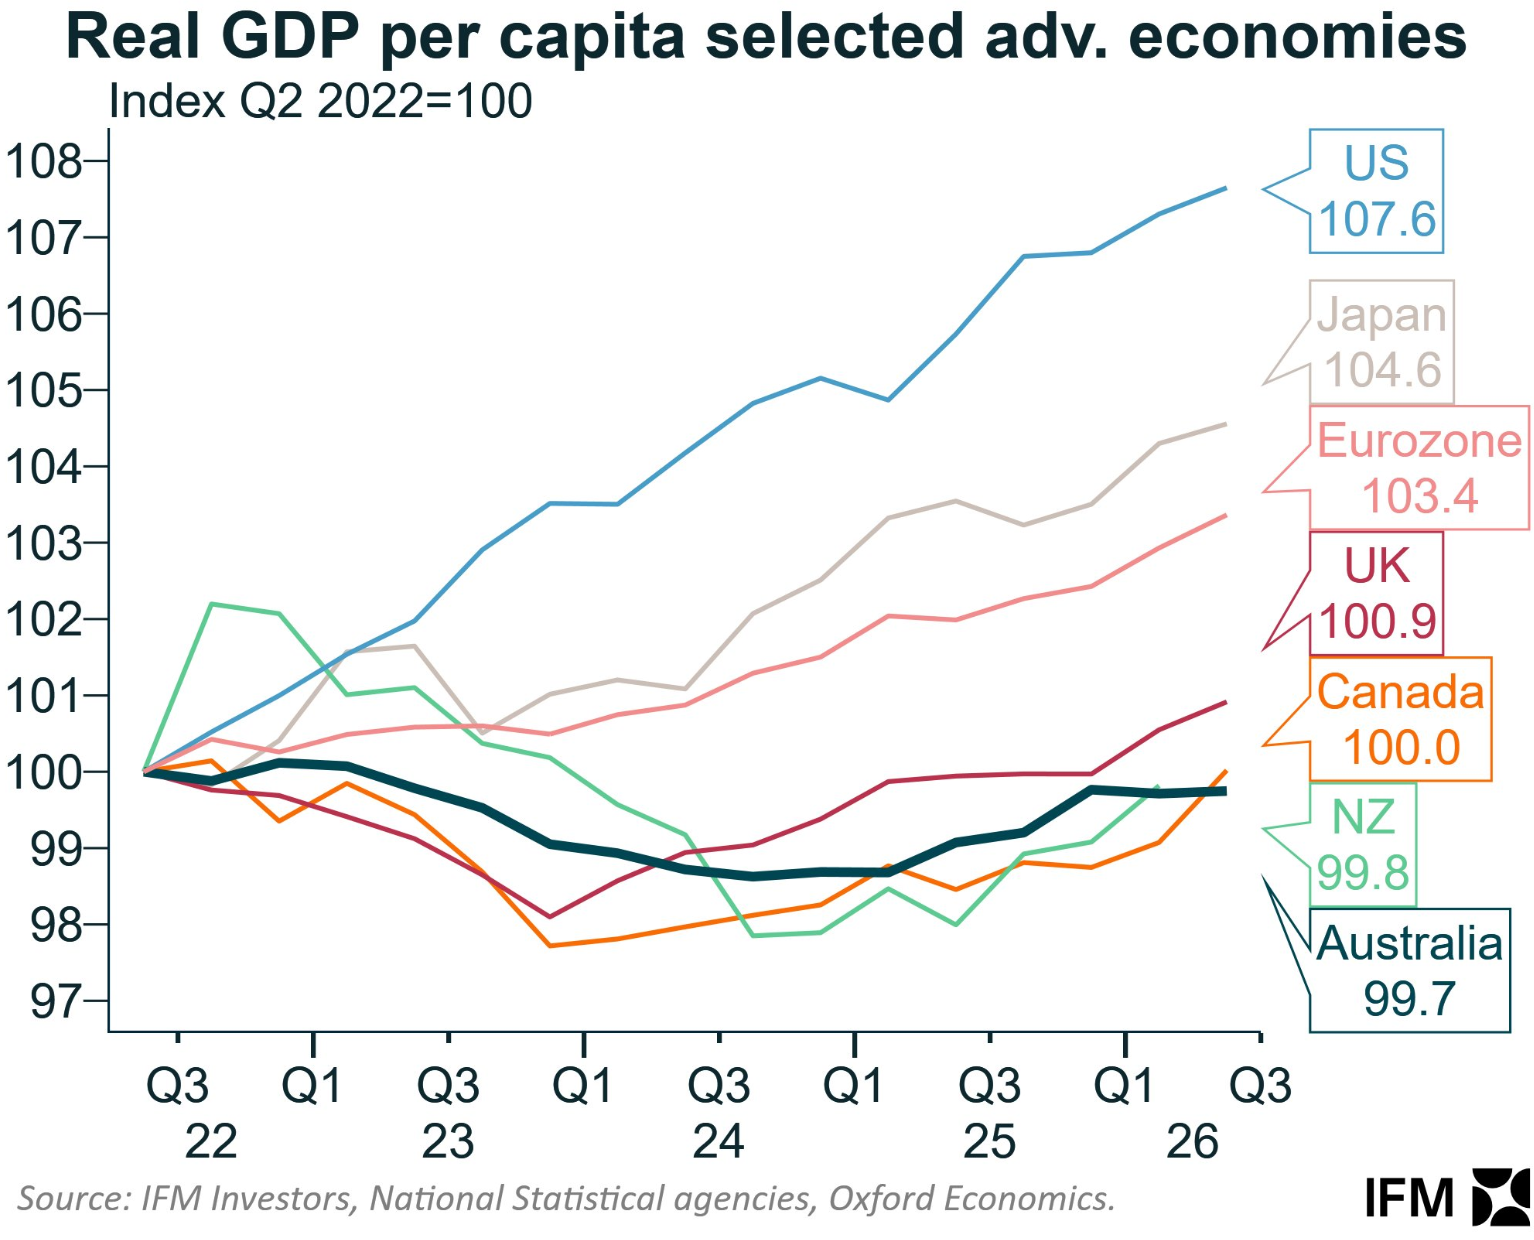
Chart from Alex Joiner (IFM Investors)
One of the main reasons Australia’s productivity growth has collapsed alongside the increase in immigration is ‘capital shallowing’.
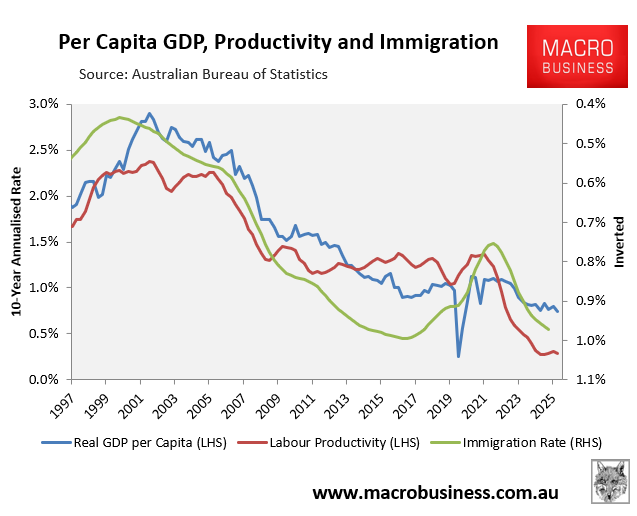
Productivity growth mainly comes from capital deepening, which occurs when the amount and quality of capital equipment, buildings, vehicles, infrastructure, and machines per person increase.
Low levels of business investment relative to GDP, combined with Australia’s high population growth through immigration, have led to ‘capital shallowing’ over the past decade, a major driver of Australia’s poor productivity growth.
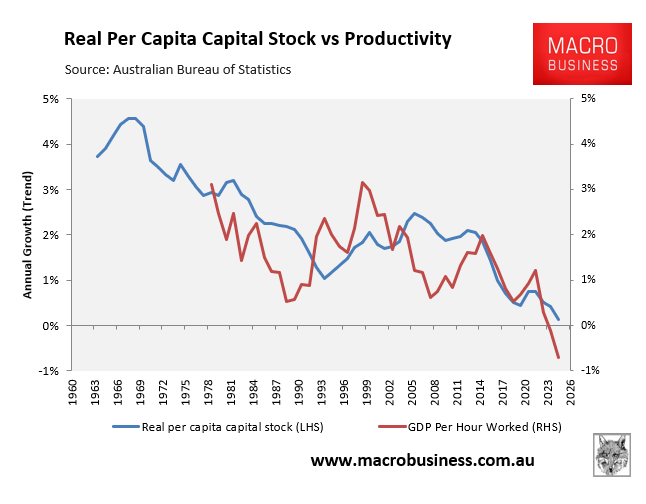
Put simply, the nation’s population has grown faster than business, infrastructure, and housing investment, resulting in less capital per worker.
As a result, most of Australia’s GDP growth has come from population growth rather than productivity, leading to increasingly low growth in GDP per capita.
Another more recent driver of Australia’s poor productivity growth is record government spending and the explosion of the non-market (government-funded) sector, which has recorded declining productivity:
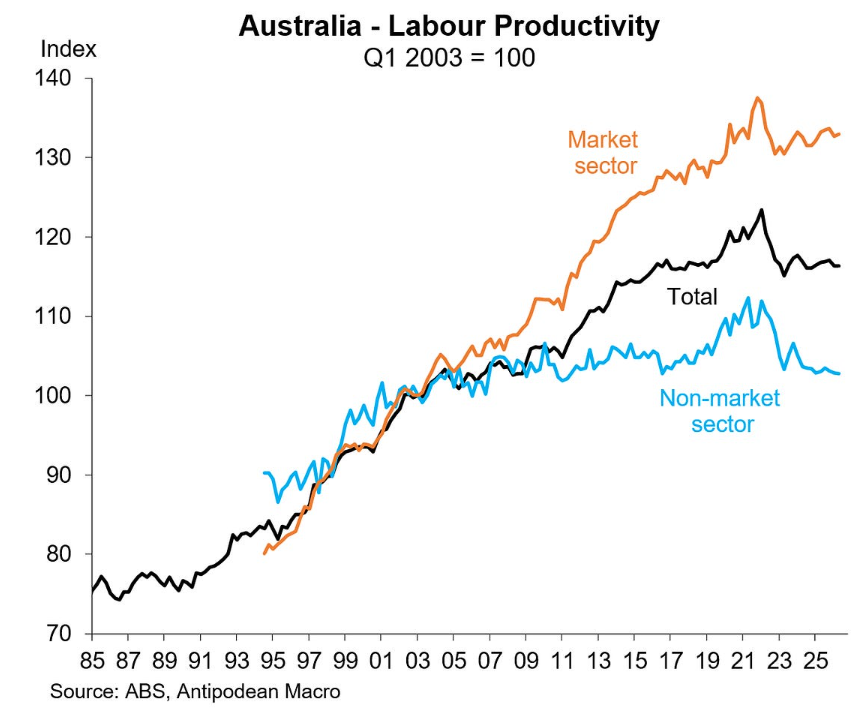
Chart from Justin Fabo (Antipodean Macro)
The bottom line is that policymakers have replaced productivity growth with high immigration, supplemented by record government spending.
This approach has grown the overall economic pie, but everyone’s slice has shrunk.
Intergenerational Report jukes the productivity figures:
According to The AFR, Treasurer Jim Chalmers has quietly reversed his own methodology for forecasting long‑run productivity to avoid a politically damaging downgrade in next week’s Intergenerational Report.
Treasury has abandoned the 20‑year average Chalmers previously championed, which implied annual productivity growth of only 0.8%, and reverted to the 30‑year average he once called “rubbish”, allowing the government to maintain its optimistic 1.2% productivity assumption.
“[The 1.2% assumption] is broadly equivalent to Australia’s average annual productivity growth over the past 30 years”, Treasury wrote in its advice to Chalmers.
Treasury’s assumption places it at odds with the Reserve Bank, the NSW government, and economists who believe productivity will grow by something closer to 0.7% or 0.8% over the long term.
HSBC chief economist Paul Bloxham lambasted the move, noting that over the past decade, productivity growth has averaged only 0.3%.
“It’s not clear to me that there are productivity-enhancing reforms in the pipeline that would get you from 0.3% to 1.2%”, he said.
Economist Chris Richardson described Treasury’s productivity assumption as “bollocks” on X (Twitter).
“In the last twenty years (the assumption used in the last IGR) our productivity growth has averaged 0.49%”, Richardson wrote. “In the last 10 years that average productivity gain has been 0.00%. Yep. Nuthin …”
“The difference between 0% a year and 1.2% a year becomes 61% over four decades”…
“And that, ladies and gentlemen, is an embarrassment”, Richardson wrote.
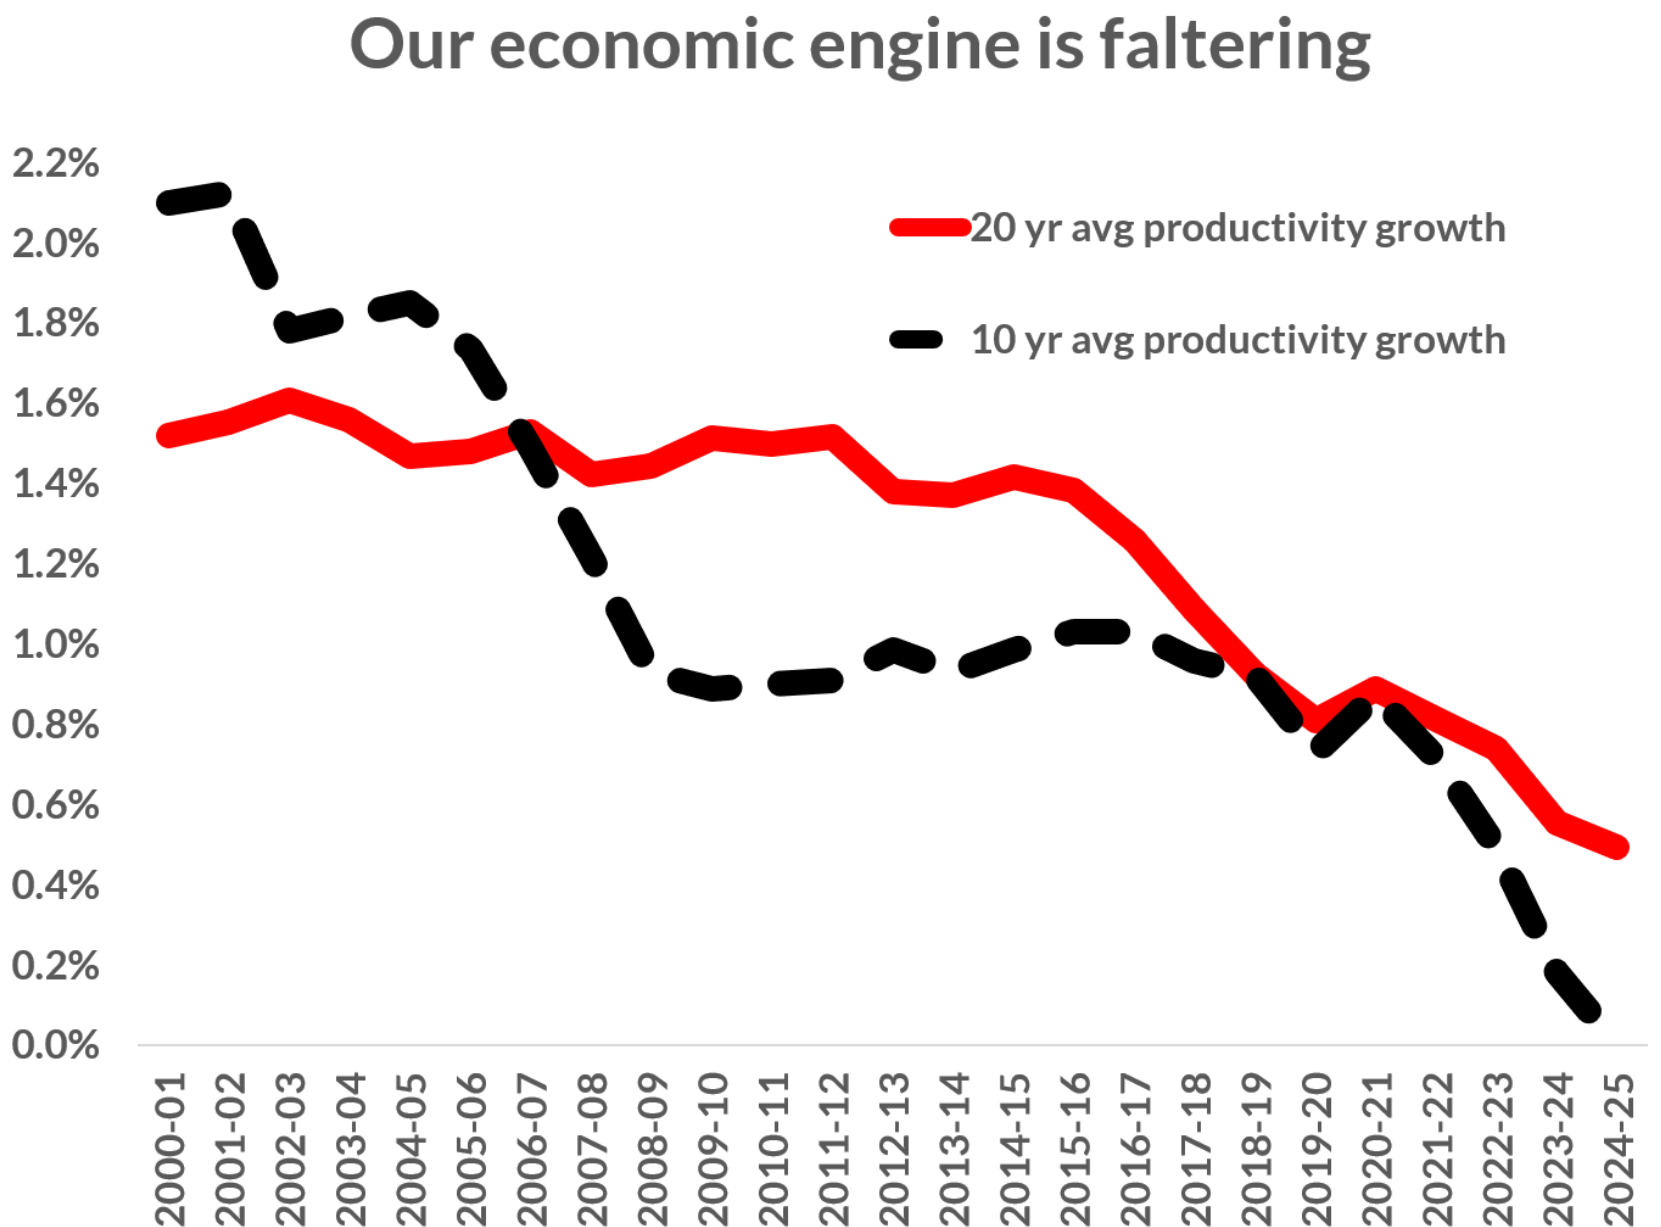
Chart by Chris Richardson
The Parliamentary Budget Office estimates that if productivity settles at 0.9% instead of 1.2%, debt would be $119 billion higher and the debt‑to‑GDP ratio 3.6 ppts higher by 2035–36.
Thus, using Treasury’s fantastical 30-year average assumption for productivity growth will avoid a politically embarrassing downgrade in the Intergenerational Report.
And the Albanese government wonders why Australians no longer trust it or the nation’s political institutions. Across all areas, Labor has resorted to lies and obfuscation rather than honesty.
