
According to Cotality’s daily dwelling values index, home values across the five major capital city markets have declined by 5.2% from their 10 April 2026 peak.
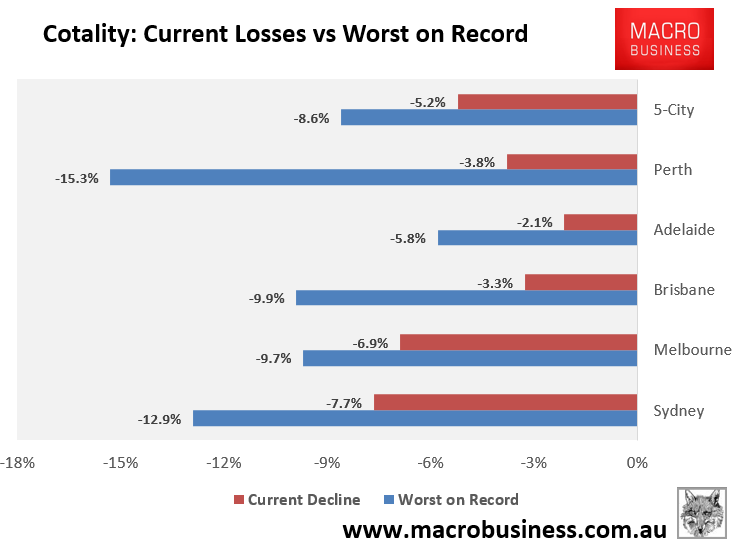
The biggest decline in 40 years of records, according to Cotality, was 8.6%, recorded between October 2017 and May 2019.
At the current pace of decline, which is 4.0%, the nation is looking at its largest decline in dwelling values for capital cities on record by the end of 2026.
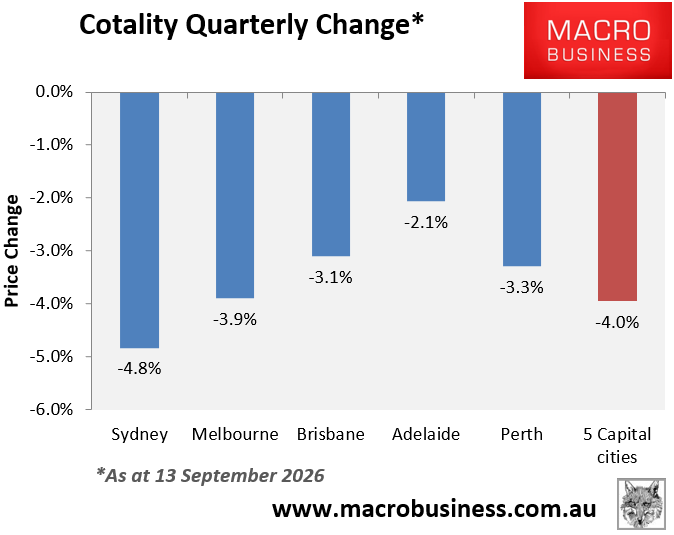
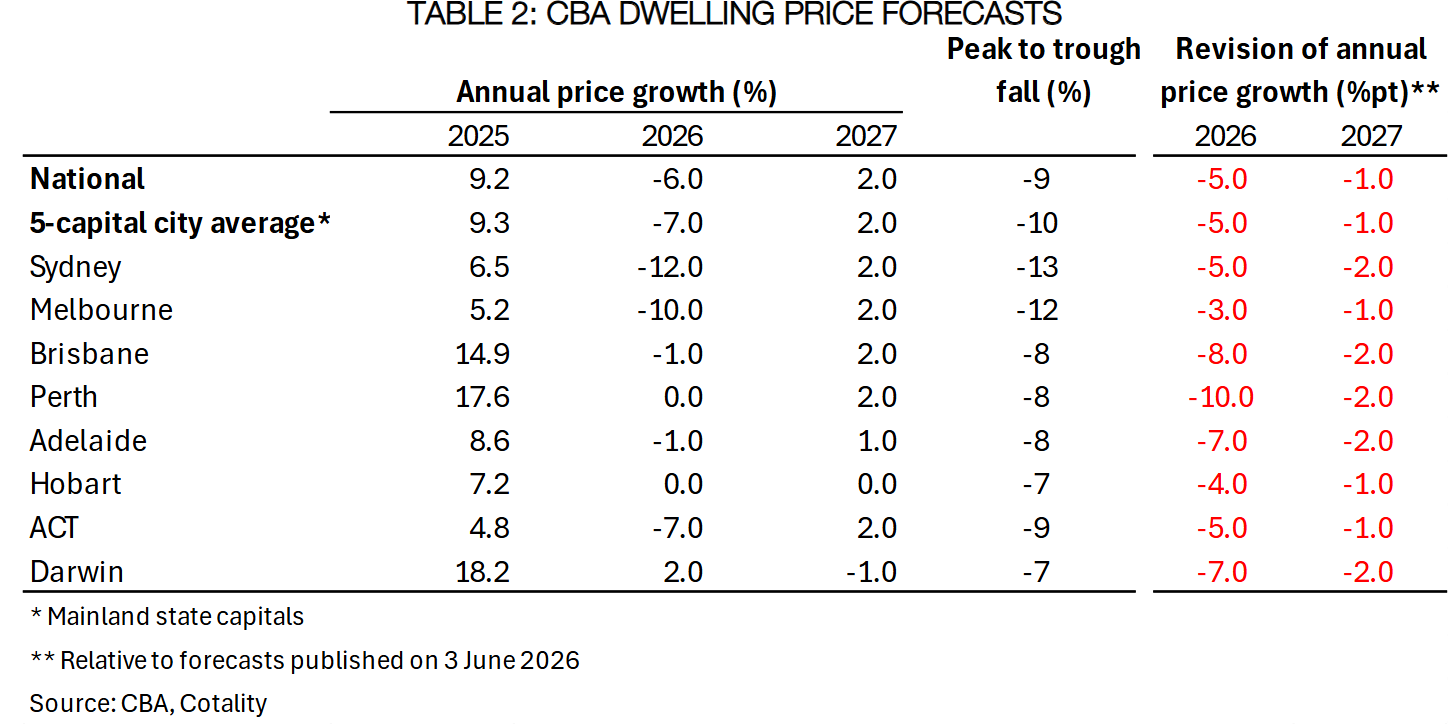
Recently. CBA’s economics team downgraded their forecast peak-to-trough decline in dwelling values for capital cities to 10%:
HSBC chief economist Paul Bloxham also downgraded the bank’s forecast peak-to-trough decline to 13% last week, citing higher interest rates and the impact of the federal budget’s changes to negative gearing and capital gains taxes.
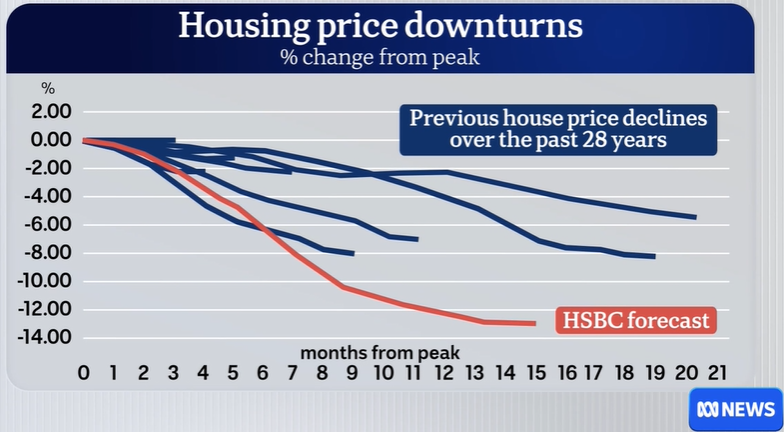
Chart from Alan Kohler (ABC)
“As we had expected, the housing market has weakened quickly following the significant tax changes that were delivered in the 12 May federal budget”, Bloxham said.
“However, the falls that have arrived have been bigger than we had thought”.
“The current housing price decline is therefore occurring with no near-term ‘circuit breaker’ to be offered by the RBA”, Bloxham added.
“As we see it, market participants need to start anticipating rate cuts to see an upswing in housing prices but we see further rate hikes in the short run and don’t expect cuts until H2 2027”.
HSBC forecasts the following peak-to-trough declines across the capital cities:
- Sydney: -16%
- Melbourne: -14%
- Brisbane: -10%
- Adelaide: -7%
- Perth: -10%
- Hobart: -7%
- Canberra: -12%
Of all of the banks, HSBC’s house price forecast seems the most realistic.
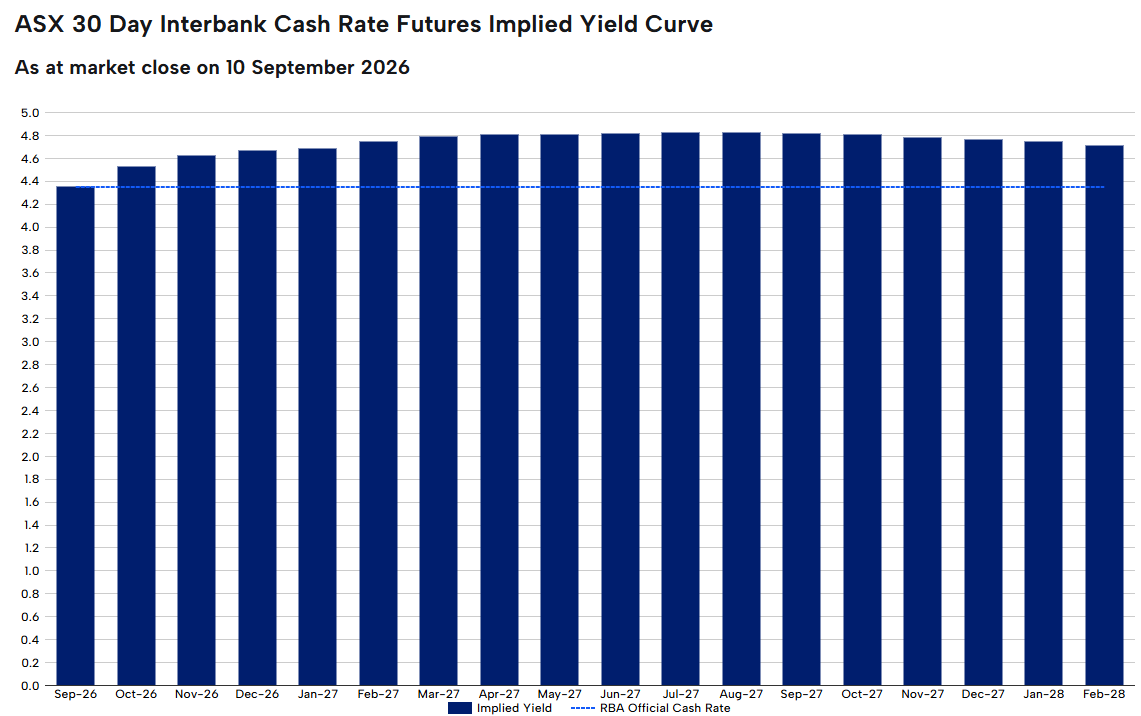
With financial markets now fully pricing in an additional two 25bp interest rate hikes, and the mortgage repayment burden already tracking at its highest level since the early 1990s when interest rates hit 17%, it is easy to see prices falling heavily from here.
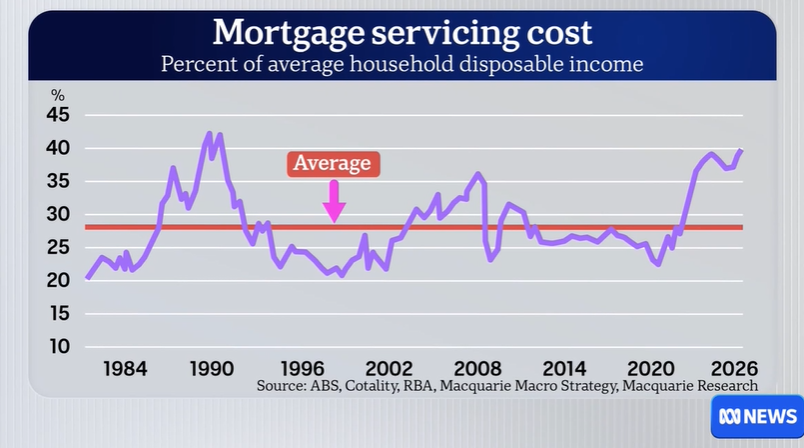
Chart from Alan Kohler (ABC)
My guess is that Australian house prices will follow a similar path to New Zealand’s housing correction, which began in November 2021.
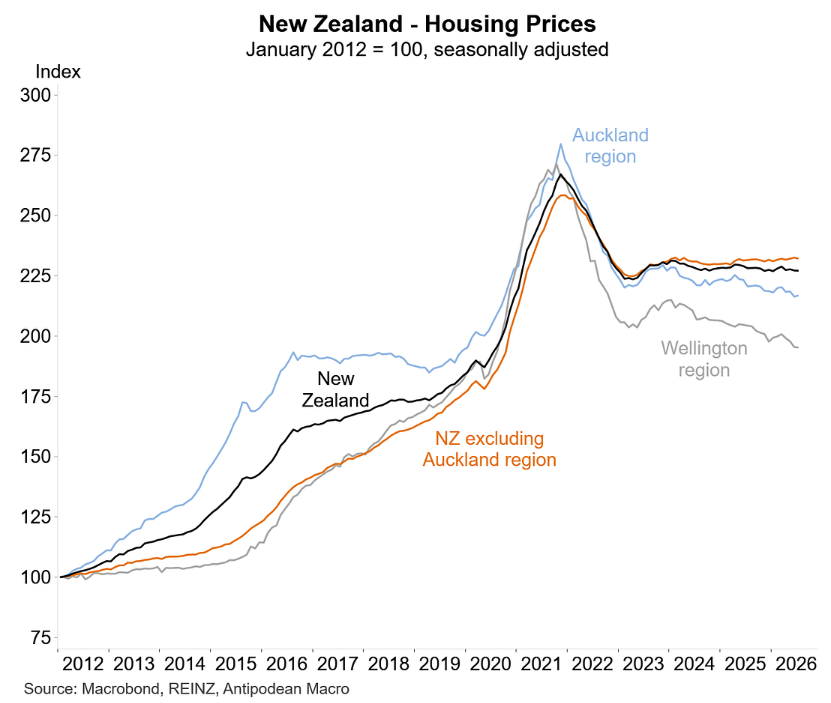
Chart from Justin Fabo (Antipodean Macro)
Prices will fall quickly for up to 18 months, then track broadly sideways for a prolonged period and decline in real, inflation-adjusted terms.
