
Australia’s house price correction steepened in August.
According to Cotality’s daily dwelling values index, which tracks value changes across Australia’s five major capital city markets, home prices declined by a hefty 1.2% at the 5-city aggregate level in August.
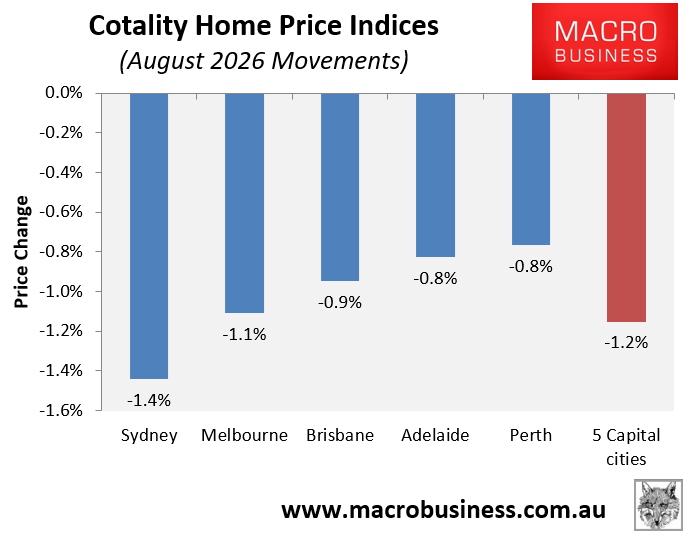
As illustrated in the chart above, declines were broad-based, with significant losses reported across the five major capital city markets.
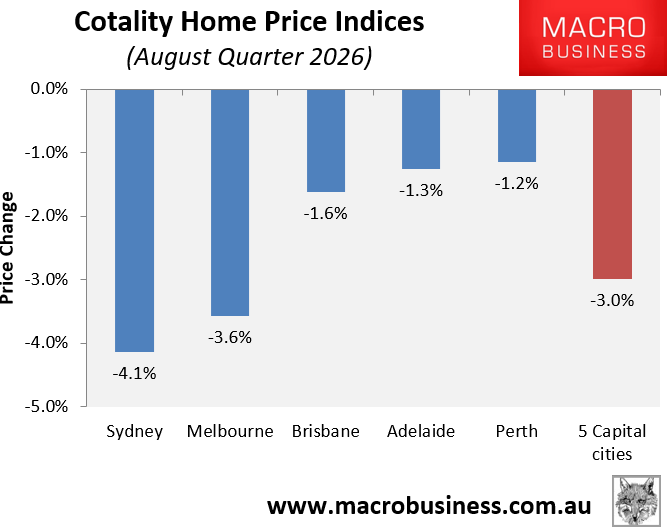
Over the August quarter, values at the 5-city aggregate level declined by 3.0%, led by Sydney (-4.1%) and Melbourne (-3.6), with Brisbane (-1.6%), Adelaide (-1.3%), and Perth (-1.2%) recording smaller declines.
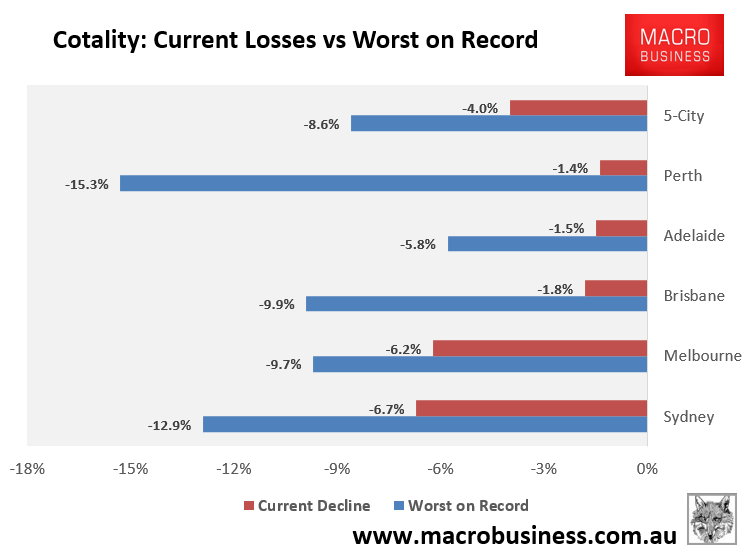
So far, values have declined by 4.0% from their most recent peak at the 5-city aggregate level and are less than halfway to their largest recorded decline, which was 8.6% between October 2017 and May 2019. However, if the current pace of decline continues, the record would be broken in the first quarter of 2027.
Sydney (-6.7%) and Melbourne (-6.2%) are leading the decline, with the mid-sized capitals joining the correction later and recording only small losses so far.
However, losses across the mid-sized capitals are likely to accelerate given that Cotality has recorded a very large increase in for-sale listings across these mid-sized markets.
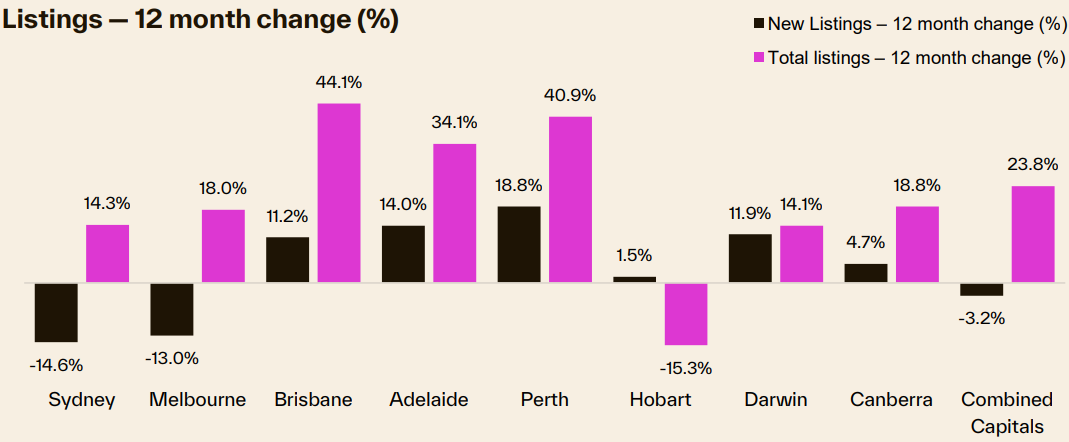
Source: Cotality
Swelling supply amid softening demand means lower prices.
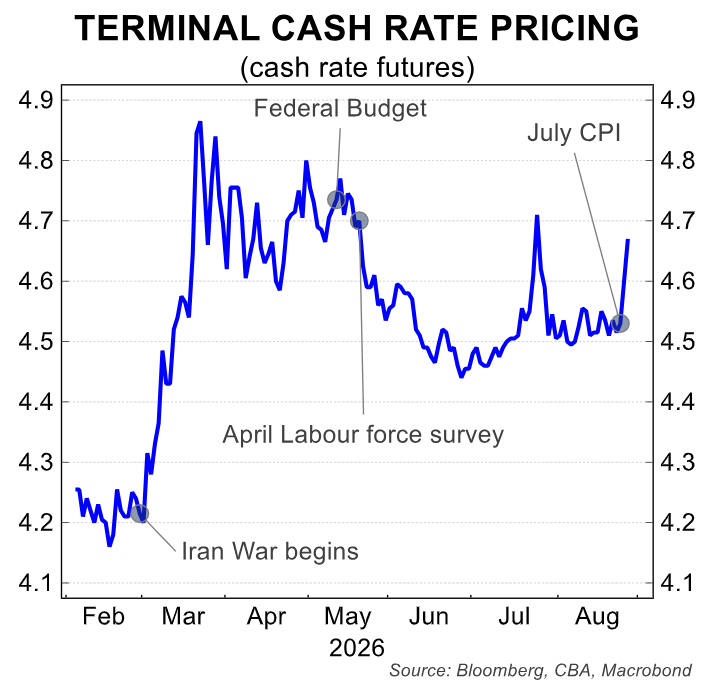
More broadly, following last week’s strong-than-expected inflation data, the Reserve Bank is widely expected to lift interest rates either at its September or November meeting. If this happens, it would likely put significant further downward pressure on home prices.
Ultimately, the equation facing Australia’s housing market is simple. Values rose well beyond what people could afford. And now the Reserve Bank’s rate hikes and the federal government’s changes to negative gearing and capital gains tax will likely deliver the largest price correction in at least 40 years.
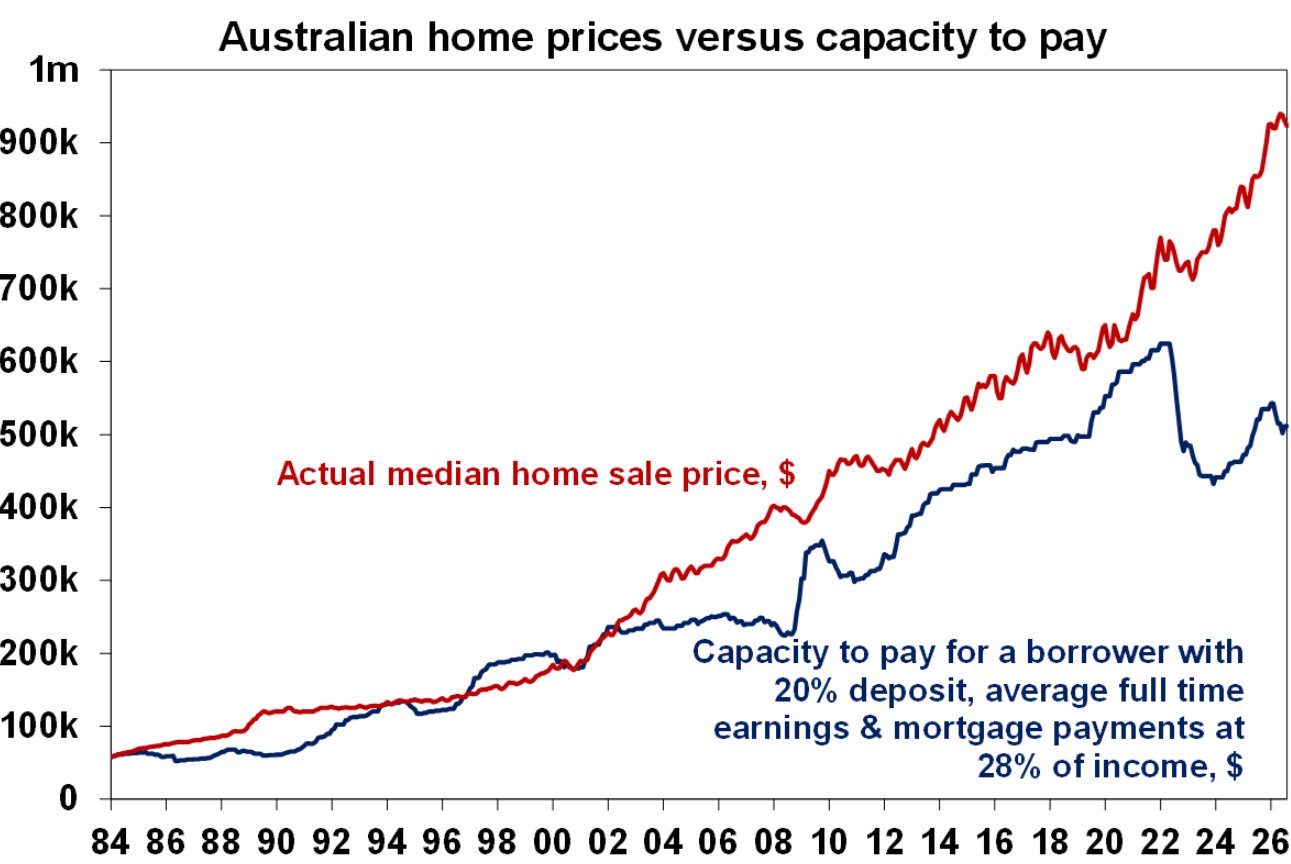
Chart by Shane Oliver (AMP)
